
Vol. XXII, No. 8, August 2022
- Editor's corner
- America's favorite ice cream flavors
- Blippi, a children's entertainer on YouTube, promotes LBEs
- Is the potential oversaturation of eatertainment venues in Atlanta a precursor for other markets?
- Which restaurant chains have the most craveable burgers?
- How fast did location-based entertainment spending recover in Q2 2022?
- Satisfaction levels in the service industry at an all-time low
- Krulak's law from Seth Godkin
- Newly acquired pandemic habits are sticking and even accelerating
- Nostalgia escape design trend
America's favorite ice cream flavors
Here we are in the heart of the summer, ice cream season! A YouGov poll in mid-July asked 1,000 U.S. adults about their ice cream preferences and habits. Following are some of the key findings.
Summer is not the only time Americans consume ice cream. Eight in 10 Americans consider it a year-round treat (80%), while one in six consider it only a summer treat (17%).
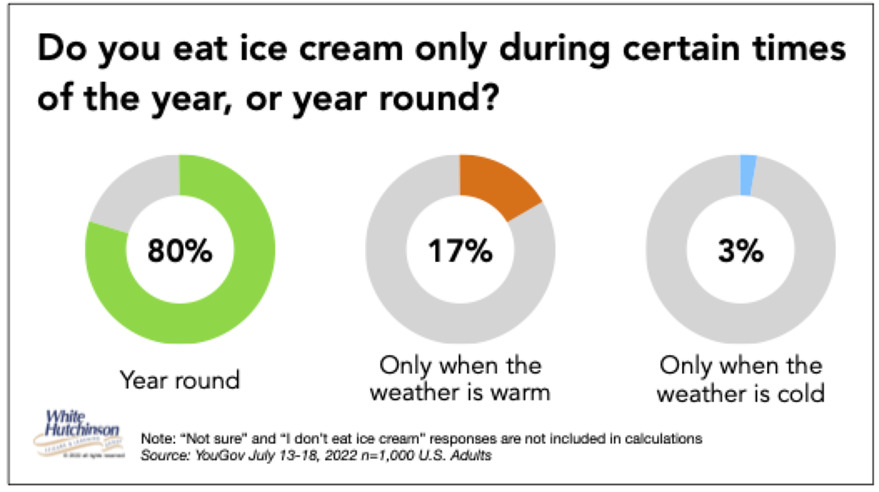
However, only 71% of Americans who have vanilla as their favorite flavor eat ice cream year-round, whereas 85% who have chocolate as their favorite flavor are year-round ice cream consumers.
When asked to choose any ice cream flavors they like from a list of 21 popular flavors and what their favorite flavor was, the flavor liked the most by Americans is vanilla ice cream (59%) followed by chocolate ice cream (51%). Eleven percent of Americans rate vanilla as their favorite flavor, and 10% chose chocolate as their favorite. Other crowd-pleaser flavors are strawberry (43%) and cookies and cream (43%), selected as favorites by 6% and 7%, respectively. Mint chocolate chip and butter pecan challenge vanilla and chocolate for favorite flavor (9% and 8%, respectively) even though neither is liked by more than 35% of Americans.
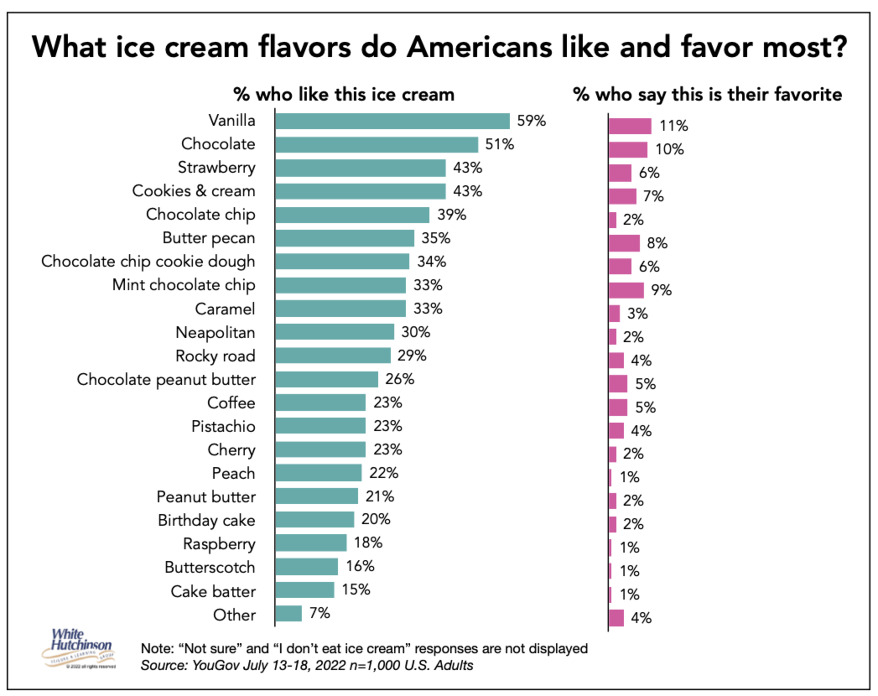
Regarding the 11% of Americas who chose vanilla as their favorite flavor, 17% of those aged 18-29 call it their favorite, compared to only 5% of those aged 30-44. There is less variation by age for people who selected chocolate as their favorite ice cream flavor, only varying between 9% and 12% by age.
Only 3% of Americans say they don't like ice cream.
There are regional differences in preferences. Southerners like butter pecan ice cream the most (42%), while Midwesterners like chocolate chip cookie dough (44%) and caramel ice cream (41%). Northeasterners are more likely to be fans of coffee ice cream (32%) and peanut butter ice cream (29%) than are people from any other region. Westerners are among the most likely to like vanilla ice cream overall (64%) and the least likely to choose chocolate ice cream (43%) as a flavor they like.
When asked to choose between chocolate and vanilla ice cream, Americans prefer vanilla over chocolate by 49% to 43%. Vanilla wins by the biggest margins in the Midwest (56% to 39%) and in the West (53% to 35%). People living in the South are more split on the question, and Northeasterners prefer chocolate (43% say vanilla, 50% chocolate).
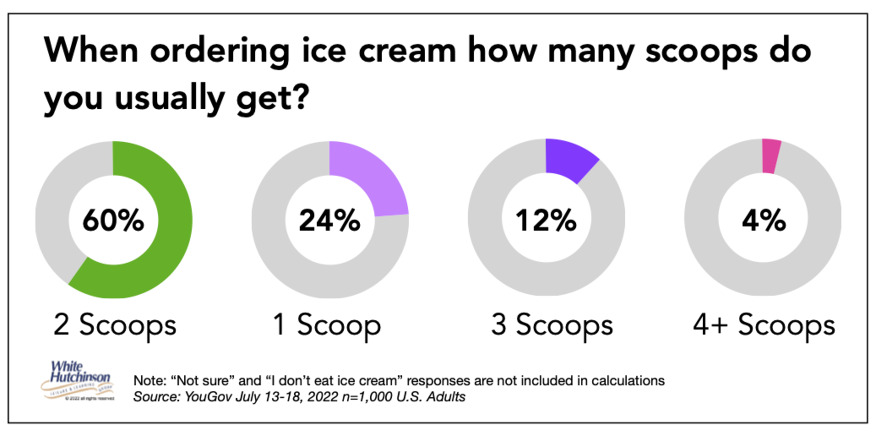
When ordering ice cream, most Americans say two scoops is the sweet spot (60%).
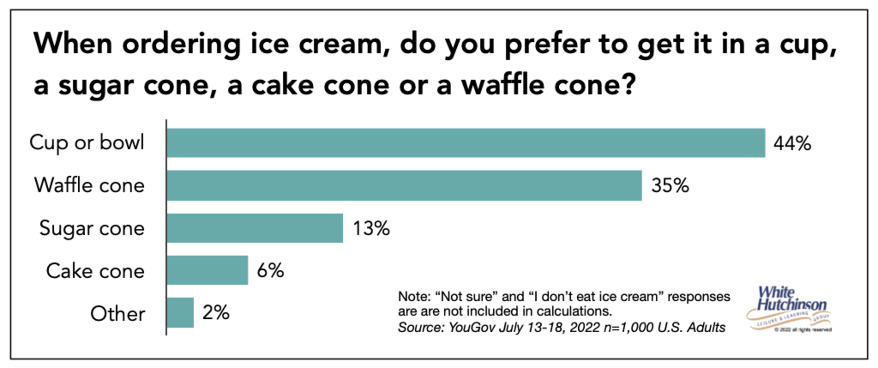
For what to get the ice cream in, the largest percentage of Americans prefer a cup or bowl (44%), followed by a waffle cone (35%), a sugar cone (13%), and a cake cone (6%).
Top choices for ice cream toppings or mix-ins are hot fudge (preferred by 43% of Americans), chocolate syrup (35%), caramel (34%), and whipped cream (34%). Just one in seven Americans dislike toppings on their ice cream (15%).
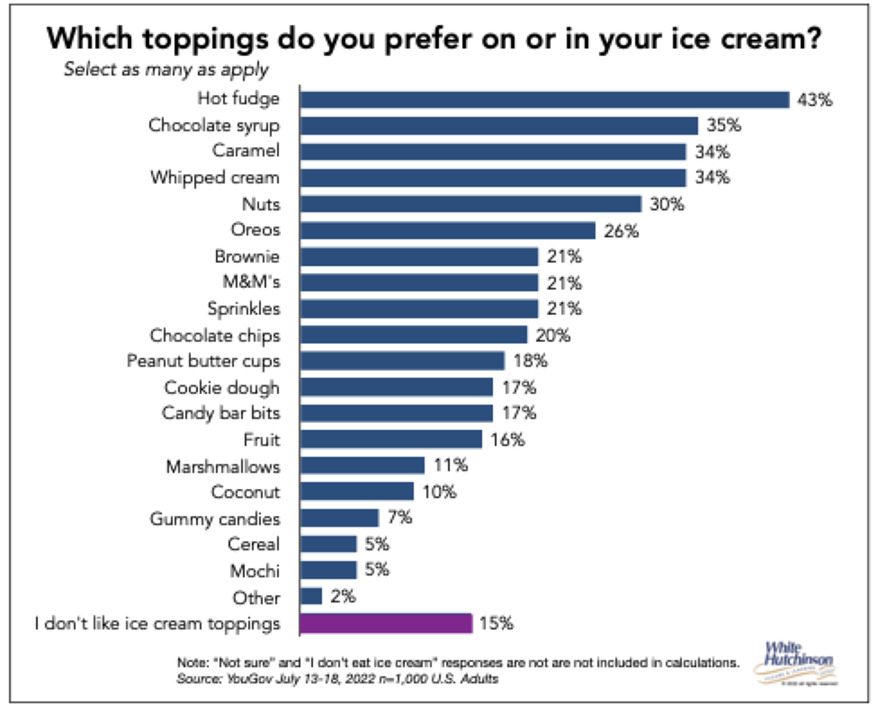
There are also regional differences when it comes to toppings. Northeasterners are more likely than people from any other region to say they like sprinkles (32%), marshmallows (18%), or coconut (16%) as ice-cream toppings. Midwesterners more like caramel (36%), brownie bites (25%), peanut butter cups (22%), candy bar bits (22%), and cookie dough (20%) when compared to people from other regions.
Vol. XXII, No. 8, August 2022
- Editor's corner
- America's favorite ice cream flavors
- Blippi, a children's entertainer on YouTube, promotes LBEs
- Is the potential oversaturation of eatertainment venues in Atlanta a precursor for other markets?
- Which restaurant chains have the most craveable burgers?
- How fast did location-based entertainment spending recover in Q2 2022?
- Satisfaction levels in the service industry at an all-time low
- Krulak's law from Seth Godkin
- Newly acquired pandemic habits are sticking and even accelerating
- Nostalgia escape design trend


