Vol. VIII, No. 2, March/April 2008
- Editor's corner
- The shifting nature of leisure time and expenditures - Part 2, looking into the crystal ball
- Number of babies continues to increase
- Foundations Entertainment University, May 6-8, 2008, Kansas City, Missouri
- Eat, drink and be famous
- The growth of indoor hotel waterparks
- Learned on women
- Indoor Legoland headed to America
- Center gets brand name and mascot
- Project construction progress
- The Whopper Bar is coming
- Add more 'TLC' and charge more
- Accessible sidewalks
- New clients
The shifting nature of leisure time and expenditures - Part 2, looking into the crystal ball
In the second in a two-part series, we offer predictions on future changes in leisure away-from-home spending that will have a significant and long-term impact on location-based entertainment (LBE) enterprises and restaurants. This is a must-read for anyone in those industries.
In Part 1 of this article in our January-February 2008 issue, we analyzed changes in consumers' expenditures since 2000 for away-from-home-entertainment and food-away-from-home and observed changes in the amount of leisure time available. If you didn't have a chance to read that article, we recommend you do so as background for this continuation (click for Part 1).
The opening article focused on the recent past. This second part will look at some very recent developments impacting away-from-home-leisure and restaurant spending and attempt to look into the crystal ball at nascent trends that will impact the future.
Some major economic structural changes have taken place in the past few years that are likely to continue and significantly impact consumers' away-from-home leisure time and spending. These changes are far more fundamental than some short-term contributors to the current economic slowdown, near recession, or whatever you want to label it. Many of these economic structural changes are global; some are domestic. Let's take a look.
One of the most significant changes is an increase in global demand for all types of commodities due to the growing economies and growing middle class in China, India, Russia, Latin American and many other developing areas of the world. The first step to a better standard of living is a better diet. This phenomenon was first identified by the 19th century German economist, Ernst Engel, and is called Engel's law — as incomes increase, people spend a smaller percentage of their increased incomes on food, but they switch from cheaper to more expensive food, such as meat and milk. This emerging middle class seeks more protein and more calories; a phenomenon called "diet globalization" and is playing out around the world. Demand is growing for pork in Russia, beef in Indonesia and dairy products in Mexico. Rice is giving way to noodles, home-cooked food to fast food. Rising incomes in Nigeria are contributing to a growing appetite for wheat. This drives up the demand for grain to feed cattle and other livestock.
Meanwhile, in the quest to become less dependent on imported oil, the U.S. and many other countries are encouraging the use of biofuels. These include grain-derived ethanol and biodiesel, which has increased the demand for corn, pushing up its price. Corn is a major feedstock for animals, so that in turn pushes up the price of meat, milk, eggs, cheese and other foods, as corn and high-fructose corn syrup are a significant ingredient in many foods. When farmers increase corn production, they decrease the acreage for other crops, including wheat. And, of course, higher oil prices don't help, as that drives up the cost of operating farm tractors and other farm equipment used in food production, as well as the cost of transporting food commodities and finished food products.
Over the past two years, the price of corn and soybeans has more than doubled. In seven of the past eight years, worldwide demand for wheat has outpaced production. The price of wheat has more than tripled during the past year. The price of just about all food commodities is rising faster than inflation, including eggs, milk, meat, poultry, cheese, barley, rice, peas, sunflower, coffee and lentils. In the U.S., the price of all farm product commodities increased 18% between February 2007 and February 2008.
The increasing cost of food commodities is starting to show up in grocery store and restaurant prices.
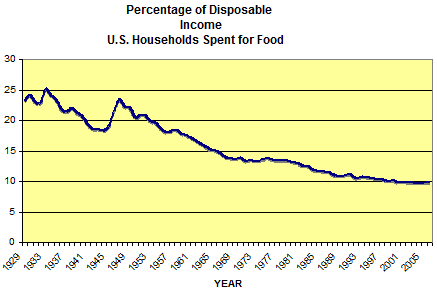
Historically, U.S. households have spent a lower percentage of their income for food than almost anywhere else in the world. In 2006, Americans spent on average 9.9% of their disposable income on food (both at home and away from home). This has been fairly consistent since 2000, when the percentage dropped to single digits for the first time in recorded U.S. history.
In 1986, American consumers spent 11.6% of their disposable income on food. In 1976, that figure was 13.6%. Going back further, Americans spent about 21%-22% percent of their income on food about the time today's Baby Boomers were born. In 1933, the figure was more than 25%.

In other parts of the world, households spend a much higher percentage of their income on food. In Japan and Germany it's 17%. Mexicans pay 25% of their income for food, and in India, it's 50%.
The world's expanding middle class can also afford to buy automobiles. Automobiles use gasoline, driving up the demand for oil. Moving to an air-conditioned apartment (or installing it in a home) and buying more electric appliances means using more electricity, again driving up the demand for fossil fuels to run the electric generators. Rapidly growing global demand for fossil fuels is driving up the cost of oil and gasoline. We recently saw oil hit $110 a barrel, and gasoline appears headed to $3.50 per gallon or higher.
The costs for food, energy (natural gas, electricity, fuel oil and gasoline), and other expenditures such as healthcare (see Part 1 of this article) are now rising faster than incomes and consuming a larger percentage of household incomes. This trend of prosperity driven demand is unlikely to subside, at least not in the foreseeable future. The United Nations' Food and Agriculture Organization projects at least 10 years of more expensive food. When the cost increases do slow down, these costs will still represent a much higher percentage of household incomes than they have in the past. What this means is that for some households, expenditures in other categories will need to be decreased.
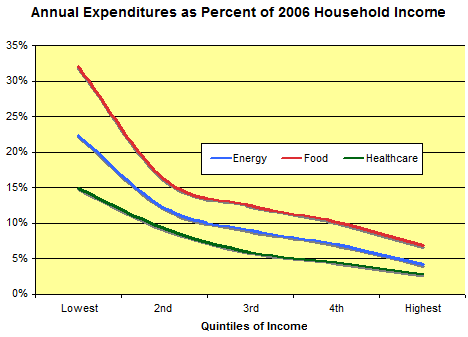
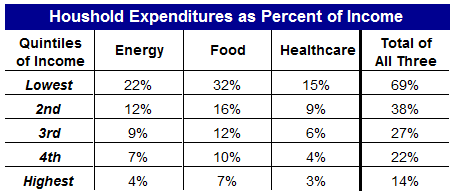
Households in the lower income categories will be hardest hit. For them, expenditures for food, energy and healthcare consume a larger percent of their income than is the case in higher income households. They will have no choice but to try to cut expenditures, especially anything considered discretionary.


Let's look at the 2nd quintile of households by income. Those households would be classified as lower middle class, earning between $18,700 and $35,100 in 2006. The combined cost of food, energy and healthcare consumed 38% of their expenditures. If the cost of the three items goes up just 5% more than their incomes, that means that unless they do without or somehow lower what they spend on these items, they will have to reduce spending in other categories by 1.9% of their expenditures (38% x 5% = 1.9%). That is almost 2.5 times what they spent on away-from-home-entertainment in 2006. That category, as a discretionary one, is sure to be severely cut in such a scenario.
Now, let's look at the 4th highest quintile of household incomes, those households that earned between $56,200 and $88,800 in 2006, which would be classified as upper-middle income. Energy, food and healthcare consume only 22% of their expenditures, so a 5% increase in the cost of the three means they have to find savings equal to only 1.1% of their overall expenditures. This is equal to what they spent on away-from-home entertainment. So although there is a chance they will cut some of their away-from-home entertainment spending along with other discretionary expenditure categories, the reduction is likely to be much less. There is another factor that comes into play here. The 2nd quintile of households by income actually spent on average $3,900 more than their after-tax income. But for the 4th quintile, their after-tax income exceeded their expenditures by $12,800. So the 4th quintile has a cushion to absorb increasing prices and may choose not to reduce spending in discretionary categories.
The highest quintile of households by income, those households with 2006 incomes exceeding $88,700, have far less of a problem absorbing price increases in energy, food and healthcare. If fact, they have no problem. On average, their after tax income exceeds their expenditures by over $47,000, so price increases in those categories will probably have no impact on their away-from-home entertainment spending, which in 2006 was 1.7% of their overall expenditures.
This disproportional negative impact of rising prices is sometimes referred to as the "middle-class squeeze." Poor and middle-class households suffer the most from inflation of the core items of energy, food and healthcare that they have little choice but to consume.
This middle-class squeeze is already occurring. Since 2006, prices for groceries, gasoline, health care and other basics that a middle-income American family consumes have risen 9.2% while average earnings have increased only about 5%. The price increases have already cost households, which made a median income of $48,700 in 2006, an extra $950 per year in expenditures, assuming they did not adjust the quantity of those items they bought.
Lower income households will have to pay for the increasing cost of energy, food and healthcare by cutting their discretionary spending for things like away-from-home entertainment. They will probably just stay home, watch TV or cruise the Internet, or will cut down on restaurant visits by eating more meals at home.
The same is not true for higher income households. As we explored in Part 1 of this article, there is a leisure time dichotomy between less educated, lower income households and more educated, higher income households. The lower income households have the most leisure time, so they can use their time to adjust their food spending by going to the grocery store more often and preparing meals at home. However, households with higher levels of education and income have far less leisure time. In fact, the amount of their leisure time is continuing to decrease, so time becomes far more important to them than dollars. Time is their new discretionary currency. They are willing to continue to pay the premium cost for restaurant meals because it saves time.
So, looking into the crystal ball to foretell the future, we believe the increased costs for energy and food are here to stay and will probably continue to increase faster than incomes, due to increasing global demand. And when it comes to health care, there is no reason to believe, despite what U.S. presidential candidates promise, those price increases will come under control, either.
We believe there will be a dual impact from the fundamental structural changes to household incomes made by these three increasing expenditure categories. Those households with less than college degrees and with lower incomes that represent about 70% of all households will be forced to cut their discretionary spending for entertainment. Also, a larger share of what they do spend on entertainment will shift from away-from-home entertainment to electronics, where they get a longer-term return on their investment. Thus, their spending on away-from-home entertainment will see major reductions. They likewise will be forced to save on food expenditures by shifting a greater percentage of their overall food expenditures to meals-at-home, reducing both their number of trips and amount of spending at restaurants.
The longer-term trend is much different for the approximately 30% of households with higher incomes and bachelor and higher college degrees. Their discretionary expenditures will not be constrained by increasing energy, food and healthcare costs. Rather, their discretionary time will become an increasing driver in their decision-making. The high value they place on their time means they're willing to trade money for it. They will increase their away-from-home food expenditures, as it saves them time, and they will become more discriminating in how and where they spend their leisure time. They will be willing to spend a higher price for a higher quality away-from-home entertainment experience. Saving money is not the issue with them. The issue is to make sure they get the most bang for their minutes. If you examine the data in Part 1 of this article, we believe you will see that these structural changes actually started about five years ago or so.
This trend towards higher quality, yet more expensive, away-from-home experiences will also affect those households in some of the lower income brackets. Although time will have far less, if any, weight in their decisions, their shrinking dollars available for away-from-home entertainment may very well drive them to seek out the best bang for their buck when they do decide to spend it. Their value equation will demand higher quality, since their expendable dollars will be less.
No different than the trend in which consumers are trading up to affordable luxury for some of their retail and food expenditures, we believe we will see an increasing trend to trade up to higher quality experiences in away-from-home entertainment. But in affordable luxury in retail, consumers trade down to some lower priced products to save money so they can trade up to the higher quality products. The away-from-home spending category will see a different scenario: less affluent households won't trade down to less expensive away-from-home entertainment. Instead, they'll save money by purchasing at-home electronic entertainment. (For more about affordable luxury and trading up, see our article, Affordable luxury, the new consumer paradigm.)
In summary, our predictions are:
Middle and lower income, non-college graduate households will:
- Decrease their frequency of restaurant visits and their overall food-away-from-home expenditures
- Decrease their away-from-home entertainment visits and spending
Higher income, college graduate households will:
- Increase the frequency of their restaurant visits and their overall expenditures
- Decrease their away-from-home entertainment visits, but spend more on each visit, probably increasing their overall expenditures
Households of all incomes (except the poorest) will:
- Trade up to higher quality and more expensive entertainment options when they do leave home
So our bottom line prediction is:
- Upper-middle and higher income, college graduate households will account for an increasing share of all away-from-home entertainment and restaurant spending
- To succeed in the future, away-from-home entertainment venues will have to offer high quality offerings, even if they need to command a higher price
Don't buy into what we are predicting? Here's just one example of how the trend is already in action in the away-from-home entertainment marketplace. In late 2007, the movie Beowulf was simultaneously shown in three versions in movie theaters: giant screen Imax 3-D, 3-D on regular theatre screens and without 3-D at cinemas. Here are the grosses per screen for its first week of distribution:
- 3-D Imax, $43,000
- 3-D in regular theaters, $13,000
- Non 3-D in regular theaters, $7,000
In regular theaters, the 3-D version cost at least $2 more than the non 3-D version. The Imax 3-D showings were priced $3 to $5 more than the others. Consumers were clearly willing to pay a premium to have a premium experience.
Vol. VIII, No. 2, March/April 2008
- Editor's corner
- The shifting nature of leisure time and expenditures - Part 2, looking into the crystal ball
- Number of babies continues to increase
- Foundations Entertainment University, May 6-8, 2008, Kansas City, Missouri
- Eat, drink and be famous
- The growth of indoor hotel waterparks
- Learned on women
- Indoor Legoland headed to America
- Center gets brand name and mascot
- Project construction progress
- The Whopper Bar is coming
- Add more 'TLC' and charge more
- Accessible sidewalks
- New clients


