Vol. VI, No. 2, April / May 2006
The two leisure-time markets
For years, market research for location-based consumer businesses has focused on available disposable income and how much of a market share of that income could be captured by a business. Today, that approach is far less valid, as it fails to recognize an important -- often more important -- part of consumers' decision making process: disposable time. As we pointed out in our first article addressing the new time component, Time for leisure in our October 2005 issue, today it's often more an issue of capturing a share of the watch rather than a share of the wallet. That article examined data from the new Bureau of Labor Statistics' American Time Use Survey (ATUS).


Today's issue is capturing a share of watch versus a share of wallet
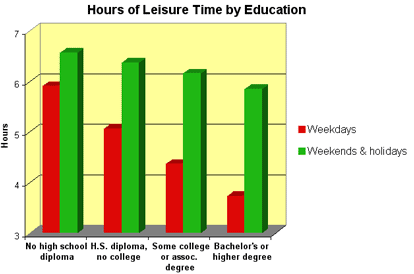
The ATUS showed that lower-income and lower educational attainment households spent more time, both on weekdays and weekends, for leisure than did higher-income and college-educated households.
A new research study by the Federal Reserve Bank of Boston has found that the amount of leisure time Americans have has actually increased between 1965 and 2003, just the opposite of what most people think (more on that later). The study examined time use studies done in 1965, 1975, 1985, 1993 and 2003. The graph that follows shows the hours per week spent by both non-retiured men and women in what the study defined as entertainment, social activities, relaxing and active recreation (Leisure 1). These activities included watching television, leisure reading, going to parties, relaxing, going to bars, playing golf, surfing the web, visiting friends, gardening and location-based entertainment.
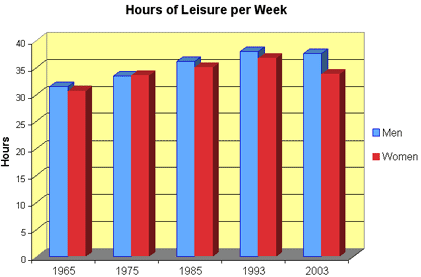
Between 1965 and 2003, the amount of leisure time for non-retired men increased 19% and for non-retired women, 10%. The increase was 5.1 hours per week for the average of men and women. That works out to 270 additional leisure hours per year. Based on a 40-hour workweek, that's the equivalent of almost 7 additional vacation days. There were decreases between 1993 and 2003 - 1% for men and 8% for women. However, the leisure time in 2003 was still substantially more than in 1965.
The study also looked at changes to leisure time based on level of education. The next graph shows that less-educated adults (no high school diploma) have gained much more leisure time than more educated adults (high school graduates or higher levels of education.) The graph measures a broader category of leisure (Leisure 2), that includes time sleeping, eating, for personal care, and primary and educational child care.
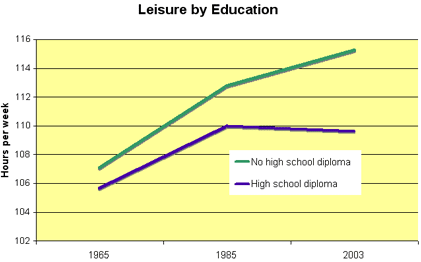
The graph shows that there has been dispersion over the 38 years in the amount of leisure time based on education level. In 1965, both the less educated and more educated enjoyed about the same amount of leisure time. In 2003, the less educated have far more leisure time. These findings by the Federal Reserve Bank of Boston are consistent with the ATUS study that also showed that the less educated currently have more leisure time. In the ATUS study (see first chart), the difference was even more dramatic (due to a broader range of educational levels examined), with adults with no high school diploma having 42% more leisure time than adults with Bachelor's degrees of higher.
Finally, we will look at the differences the study found in changes in leisure time for both adults with and without children using the Leisure 2 measure of weekly leisure time.
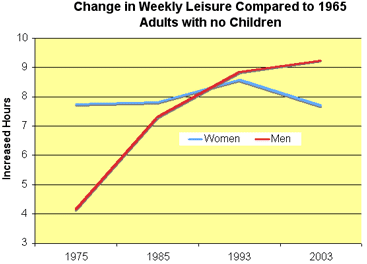
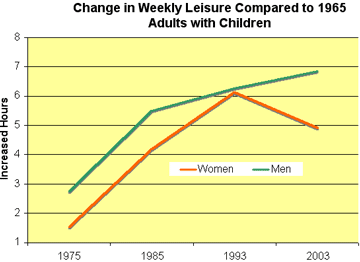
The growth in the amount of leisure time has been most dramatic for men without children. In 2003, men without children enjoyed 9.2 more weekly hours of leisure than did their counterparts in 1965. The amount of leisure time for women without children has basically remained constant. For adults with children, the growth in leisure time was significant; 6.8 hours for men and 4.9 hours for women.
A March 2006 study of vacation time by the Leisure Trends Group, a research firm that tracks Americans' leisure habits, tends to support the disparity in disposable leisure time between lower paid and higher paid workers. It found that managers and professionals, among the highest paid individuals, take just 54% of their allotment of vacation days, whereas low-wage earners who make under $40,000 annually take 77% of their vacation days.
So what's going on? How can it be that we have more leisure time today when, in fact, Americans feel so time-strapped? We offer several explanations.
Today, most people have far more choices of how they can spend their leisure time. There are far more leisure options than were available years ago. So people want to squeeze in more activities, making it seem like there is less time today to enjoy things than there was in the past.
Dr. Daniel Hamermesh, an economist at the University of Texas at Austin, sees things a little differently from an economist's viewpoint. A recent study he completed on time-pressured adults in couple relationships with at least one partner working found that people today have far more disposable income, opening up more opportunities, as they can afford more leisure options. In reply to people complaining that there isn't enough time in the day for everything they want to do, Hamermesh says, "If somebody complains, I say, look it's not the problem - the problem is you have too much money... It's basically yuppie kvetch, complaining by the well-to-do." The study Hamermesh co-authored with graduate assistant Jungmin Lee found that the more money people have, the more pressured they'll be as they try to find ways to spend it all. This was true even if there was no change in the number of work hours, i.e., time stress increases with income, not because more income is synonymous with more work hours (of course, longer work hours will also increase time stress.) And the study didn't just look at survey data from the United States, but also from Australia, Canada, Germany and South Korea.
As Hamermesh sees it, there are only so many hours in the week in which a person has some flexible time. With more money comes more options, which leads to greater stress in trying to get everything done.
Conversely, Hamermesh found that people who have less money don't complain about not having enough time. Not surprisingly, they're more concerned about their income.
Another one of Hamermesh's findings was that women - particularly wealthy women who do not work outside the home - complain the most about time stress. He speculates that the cause of this is that women tend to be household managers, and hence have more tasks to juggle than men do.
So what we see today with a large segment of the population is a large disposable income, making more options available for leisure, or as Hamermesh sees it, creating a perceived need to spend that disposable income. This leads to the phenomenon of a perceived scarcity of leisure time, or what could be called time poverty. And because our leisure time is limited and we want to do more than we have time to do, we place a much higher value on the use of our disposable leisure time. We sure don't want to waste our time, but rather have it be of the highest possible quality.
This increased wealth and the desire to maximize the value of our time has led to both the experience economy and the quest for affordable luxuries, including luxury experiences, known as trading up or New Luxury. In the experience economy, people are no longer satisfied with goods and services. Time is the most important commodity. We want every activity we do away from work to have the highest perceived value in the use of our time, and we are willing and able to pay for those higher-quality experiences. If we are shopping, we want more than a utilitarian trip to the store, we want the time we spend to be an experience, and we are willing to pay a premium for the goods that are sold during that experience. Examples are Bass Pro, Cabela's, the Macintosh Store, Restoration Hardware, Whole Foods and Williams Sonoma. If we are going out to dine, we'd rather pay $7.50+ at Panera Bread or Chipotle than $5 at McDonald's, as we want the higher quality dining experience that goes with the food, the better ambiance, the display kitchen where we see the food being prepared-to-order while we watch, and while we're at it, the higher quality food as well.
Starbucks exemplifies what this trend is all about. You can get decent coffee at a lot of locations for a buck or so. You can make it at home for even less. You can buy Starbucks coffee and brew it at home for less than you pay at a Starbucks location. So why are we willing, in fact for a lot of people, eager, to spend $3 to $5 for a cup of coffee at a Starbucks? Some commentators are calling it the Starbucks Syndrome. Starbucks has raised our expectations about what a cup of coffee is. It's no longer just a beverage. It's the experience, an emotionally rewarding feeling that you are treating yourself to an affordable luxury. The time we spend purchasing the coffee at Starbucks now has a higher perceived value. It's no longer just a utilitarian transaction. And as Dr. Hamermesh points out, we can afford these luxuries and are in constant search for ways to spend our money while having rewarding, good feeling experiences. Whole Foods and Trader Joe's are other examples. They aren't those antiseptic supermarkets. It's a fun and even educational experience roaming the aisles and loading your shopping cart with premium quality and (premium priced) items.
And most amazing of all, it's not really a guilty pleasure, but rather one we justify by thinking we're treating ourselves while taking care of a utilitarian need. We rationalize the premium cost simply because the experience makes us feel good. In fact, in many ways, that's what New Luxury is all about. Treating ourselves with an emotionally rewarding experience while taking care of some utilitarian need, whether it's eating at a restaurant (examples: Cheesecake Factory, Pei Wei Asian Diner, Panera Bread and P.F. Chang's China Bistro), or shopping (examples: Restoration Hardware, Williams-Sonoma, Whole Foods and Pottery Barn), or purchasing an appliance that makes us feel good about owning and using it (examples: Zero King and Viking), or owning a car that makes us feel we have a more enjoyable driving experience (examples: Lexus and BMW). And with consumers' increased wealth, they are seeking quality necessities that come with those emotionally rewarding experiences, and they are able and willing to pay a premium price for them.
So getting back to where we started in this article, that most people today actually have more leisure time than in the past, this pursuit of New Luxury experiences starts to reveal why people with the most income feel they have the least time. Simply, they are hooked on rewarding experiences and have the income to pursue them, including the many affordable luxuries like Starbucks and better shopping and restaurant experiences and want to enjoy as many as possible. And at the opposite end of the spectrum, there are the consumers who are money poor and time rich. With the most leisure time, they don't feel time pressured because their incomes preclude pursuing many leisure options.
In many ways the leisure time market is dividing itself into two classes of customers:
- More upscale consumers, those with ample discretionary income who feel time pressured, and
- Lower income consumers with ample discretionary time, but little discretionary income
It's much like the scenario of the lower-income, price-conscious Wal-Mart customer versus the higher-income, value-conscious Target customer. Except when it comes to the leisure market, we have the time conscious, upscale customers versus the price conscious, moderate income customers with time to spare. There are the two basic groups of customers and little if any middle ground.
We've seen evidence of this bifurcated market in many location-based entertainment facilities (LBE). There's what we call the carnival in a warehouse indoor LBEs and the concrete desert outdoor LBEs. Lacking any ambiance or quality, these LBEs attract a lower-middle income customer, those who must consider price an issue. And these LBEs fail to attract the more upscale market, people who are turned-off by the low quality and lacking ambiance and don't want to waste their valuable leisure time on such a poor overall experience, even if the cost is low. Sales at these LBEs end up being marginal at best and most fail to survive past their third year.
Then there are the upscale LBEs that do a good job of attracting the upscale time-pressed market that will gladly pay a premium for an emotionally rewarding experience, one that matches their expectations based upon all the quality restaurants, stores and other businesses they frequent. Dave & Buster's is just one example. Sure, their facilities cost $200+ per square foot to develop, but they also generate sales in the $200 per square foot range. Chuck E. Cheese's has also been upscaling their facilities to attract the higher-end customer.
See, here's where the success equation really pans out. It's the upscale customers who generate the majority of spending on leisure away from home. In fact, in 2004, those households with $81,000 and above incomes, the top 20% in income of all households, accounted for over one-half (51%) of all fees and admissions at location-based entertainment facilities. And if you add the households with incomes between approximately $52,000 and $81,000, then the households that account for the highest 40% of all households by income are responsible for three-quarters (74%) of all entertainment fees and admission spending. When it comes to food-away-from-home, households with $52,000 incomes and above account for 62% of all expenditures.
So the bottom line for LBEs is:
- It's the upscale customers that have the income to spend at LBEs,
- however, they are the most time pressured,
- therefore they are demanding high quality experiences.
- But they will gladly pay a premium for quality emotionally rewarding experiences,
- and they account for the lion's share of expenditures,
- so they represent the market niche to chase for success.
Additional reading:


