

Vol. XVII, No. 8, December 2017
- Editor's corner
- More about the appeal of LTOs
- Unpartnered share of Americans on the increase
- Meet the conscientious consumer
- Ocean5 and Table 47 about to raise the bar
- A shrinking young adult market
- The importance of great designed spaces
- Out-of-home entertainment expenditures on the increase
- It's no longer about entertainment; it's all about the experience
- The marriage of food and entertainment
- Outdoor attractions are solid FEC profit centers
- Wake up at dawn to dance at this new rave
- Households with children on a downward slope
- New CLVs worth noting
Out-of-home entertainment expenditures on the increase
As part of the continual consumer and leisure/entertainment trends research our company undertakes so we can best serve our clients, we track changes to entertainment spending both at community leisure venues (CLVs within 50 miles of home and not on an overnight trip) and on trips using data from both our own nationwide consumer surveys and analysis of data collected from the Census Bureau's Consumer Expenditure Survey (CEX). The CEX changed its data collection methodology for community-based entertainment starting in 2013, so data from that year forward can't be compared with earlier years in terms of the dollar amount of household spending.
Since 2013, there has been an increase in overall out-of-home (OOH) entertainment spending. Between 2013 and 2016, average inflation-adjusted OOH entertainment spending increased by 12%. The greatest dollar increased was with the top 40% of income households (approximately $65,000+). They accounted for almost two-thirds of the increased spending (63%) and now account for three-quarters of all OOH entertainment spending (73%). The top 20% of households by income ($108,000+) now account for one-half of all the spending.
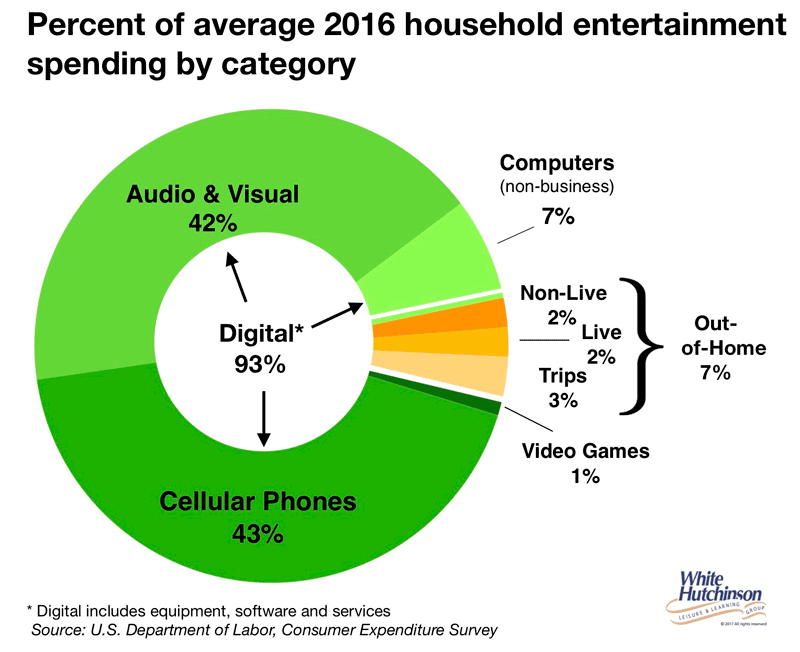
The vast majority (71%) of the total OOH increase in spending was for entertainment on trips, where since 2013 average household spending increased by one-quarter (24%). Entertainment spending in the local community only increased 6%, but over three-quarters of that increase (77%) was for live entertainment - plays, theatre, concerts, etc. The increase for non-live entertainment, such as found in typical FECs, was only 2%.
The big increase in average household entertainment spending was for digital entertainment. Its dollar increase was 12 times the amount of all the OOH entertainment spending increase. Put another way, the OOH entertainment spending increase was only 8% of the total dollar increase for average household entertainment spending between 2013 and 2016. The other 92% was for digital entertainment.
In 2016, average household OOH entertainment spending was only 7% of all entertainment spending. The vast majority of entertainment spending, 93%, was for digital entertainment equipment, software and services.
Although there has been a small increase in average household OOH entertainment spending since 2013, long-term trends show that digital entertainment spending is gaining ground while OOH is losing. In the year 2000, average household OOH entertainment accounted for one-seventh of all entertainment spending (14%). Since then, digital entertainment has increased by 71% while OOH entertainment spending has declined by 13%. OOH entertainment is now only one-twelfth of all entertainment spending (8%).
This clearly demonstrates that the many digital entertainment options available today pose serious and growing competition to all forms of out-of-home entertainment for both consumers' leisure time and their discretionary spending. The bar to get the consumer out of their home is so much higher today than in the past and is sure to keep rising as new home-based technologies go mainstream, including virtual reality and mixed (augmented) reality.
Vol. XVII, No. 8, December 2017
- Editor's corner
- More about the appeal of LTOs
- Unpartnered share of Americans on the increase
- Meet the conscientious consumer
- Ocean5 and Table 47 about to raise the bar
- A shrinking young adult market
- The importance of great designed spaces
- Out-of-home entertainment expenditures on the increase
- It's no longer about entertainment; it's all about the experience
- The marriage of food and entertainment
- Outdoor attractions are solid FEC profit centers
- Wake up at dawn to dance at this new rave
- Households with children on a downward slope
- New CLVs worth noting