

Vol. XIV, No. 4, May 2014
- Editor's travelogue
- Do you really know who your competition is? - Part 2
- The different generations
- We're a Foodie Nation
- Early bird discount ends in 12 days
- A nascent trend - entertainment + restaurant + bar = third place social
- Births down, but don't despair
- The folly of not meeting the rising expectation for food sophistication and healthfulness
Do you really know who your competition is? - Part 2
In last month's issue in Part 1 of this article, we discussed how the entertainment competitive landscape is being redefined with different forms of digital technology taking market share of both dollars and leisure time away from location-based entertainment (LBE) venues. The household spending changes we examined showed a decrease in household LBE and sports fees and admissions spending and rapid increases in spending for digital forms of entertainment and leisure.
As they say, often the devil is in the details. So we have dug deeper into the data to examine the shifts in spending based on household incomes. We examined spending by the five different quintiles of household income at the beginning of the Third Millennium - the year 2000, the last full year before the beginning of the Great Recession - 2006, and finally in 2012. All data was inflation-adjusted to 2012 dollars. The graph below shows the changes in spending by the household income quintiles for these two large spending categories:
Consumer Digital Technology & Services includes spending on all types of audio and visual electronic equipment and services (not including musical instruments), cellular phones and services, and computer-type hardware, software, games and accessories for personal use.
Entertainment & Sports Admissions & Fees includes fees and admissions to movie theatres, museums, zoos, theme parks, family entertainment centers and related entertainment venues and to sporting events.
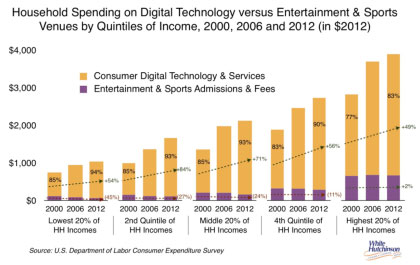
If you study the graph, you can quickly see a number of major trends:
- A long-term trend in spending changes started before the Great Recession.
- All but the highest 20% of income households have declining expenditures for entertainment and sports admissions and fees. The lower the incomes, the greater the percent reduction and the lower the amounts they spend.
- All quintiles have been dramatically increasing their spending on consumer electronics and services.
- The highest income households account for the greatest share of spending in both categories. The top 20% of income households accounted for more than half (56%) of entertainment and sports admission and fees, up from 49% in 2000.
- The lower four quintiles of household income spend over 90% of their entertainment spending on electronics and services and that share has increased since 2000 (see Part 1 for discussion on how the vast majority of that spending is for entertainment).
We are in the mist of a profound shift from physical to digital entertainment and it's happening faster than most people realize.
There can be little doubt from this chart that entertainment spending is migrating to the digital entertainment world to the detriment of entertainment venues. The digital world is now the most serious competition to real world entertainment and sports venues, more so than the real world competition. The digital world competition is sure to increase with the evolution of technology, social media and apps.
Vol. XIV, No. 4, May 2014
- Editor's travelogue
- Do you really know who your competition is? - Part 2
- The different generations
- We're a Foodie Nation
- Early bird discount ends in 12 days
- A nascent trend - entertainment + restaurant + bar = third place social
- Births down, but don't despair
- The folly of not meeting the rising expectation for food sophistication and healthfulness