Vol. XII, No. 2, February - March 2012
- Foundations Entertainment University & Amusement Expo
- Trends in middle-class entertainment spending
- DNA conference
- Toddlers don't need tokens to win crane machine prizes
- Family entertainment center architectural design: Getting it right the first time
- Construction progress at Club Liko in Cairo, Egypt
- Is what's happening to cinemas a bellwether for location-based entertainment?
- New clients
Trends in middle-class entertainment spending
There has been a lot of media coverage and political dialogue about the middle class and their falling purchasing power and wealth, creating an American society that is becoming more and more unequal. The statistics and research we have examined definitely substantiate this claim and indicate that it is a much longer-term trend than just caused by the recent recession and continuing unemployment.
We decided to examine what impact the squeezed middle class is having on entertainment spending. To do this, we first have to define what middle class means. That becomes a challenge, as there is no definition for middle class that researchers or academics have been able to agree on. The problem is that middle class is a social class that is in the eye of the beholder. When Americans are surveyed to determine who identifies with being a member of the middle class, you get a wide range of answers depending on the particular survey and how it is asked. A July 2011 survey by Rasmussen Reports found that 57% of working American’s say they’re middle class and one-fifth consider themselves poor. A 2010 ABC poll found that that 45% consider themselves middle class. As the Pew Research Center found in their 2010 survey, when you include the options of upper-middle class and lower-middle class in the survey, you end up with nearly 9 in 10 saying they are members of the middle class. The other problem with trying to define middle class is that there aren’t any clear boundaries in terms of income, education, occupation, standard of living or other characteristics that can then be used to define who is middle class for analysis.
So for our examination of changes to middle class entertainment spending, we decided instead to turn to a definable measure that can be statistically analyzed based on available data. We will look at middle-income Americans. Although income doesn’t precisely measure middle class, it is the best measurement available for this purpose. To define what middle-income is, we looked at median (half more and half less) household income, the threshold for poverty and a measure of economic family security. Median household income in 2010 was $49,445.
Based on those measures, we will define middle-income as between approximately 1/3 below and 2/3rds above median income. This means we end up looking at the 40% of households in the 3rd and 4th highest quintiles of income. Some social scientist also include the 2nd quintile of income as middle-income. The problem with that is that the 2nd quintile includes households classified as being in poverty. So for our analysis, we will stick to the 3rd and 4th quintiles of household income as a reasonable approximation for middle class:

Instead of examining out-of-home entertainment spending for only fees and admissions at such venues as family entertainment centers, concerts, theme parks, museums and other attractions, we will also look at spending on admissions to sporting events and gambling losses at casinos, other gambling venues and lotteries, as the casinos and venues such as horse tracks are also major forms of out-of-home entertainment. And since our previous research shows that the digital world is capturing entertainment market share, we will also examine spending on video game hardware and software.
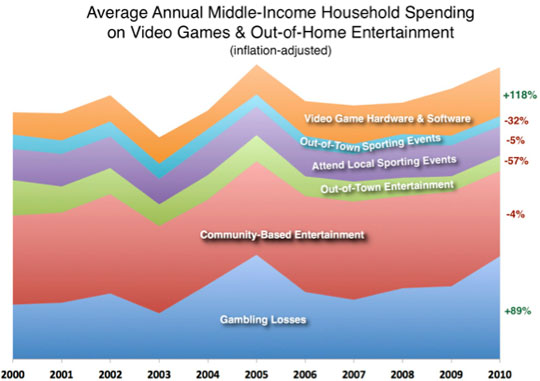
The following is an infographic that illustrates middle-income households’ annual changes in spending (inflation-adjusted) for these different entertainment categories from 2000 to 2010. The percentages just to the right of the graph show the change in spending for each category between 2000 and 2010.

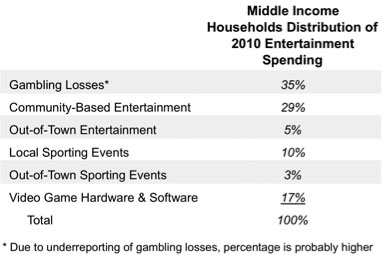
Several things stand out from the data. First, spending by the average middle-income household in total for entertainment (as we have defined it by these categories) actually increased 18% since 2000 from a per household average of $302 to $358 in 2010. However, the increase came totally from increased spending on gambling (+89%) and video game hardware and software (+118%). Gambling grew from 22% to 35% of all entertainment spending by middle-income households and video games from 9% to 17% (in reality, people tend to underreport gambling losses, so gambling probably now captures far greater than a 35% share of entertainment spending.) Middle-income households decreased their spending in the other categories, with the greatest percentage and dollar decreases occurring to spending on trips for both entertainment (-57%) and sporting events (-32%).
When you think about it, 2010 average middle-income household spending on all entertainment of $358 per household is not a whole lot of money (of course subject to the amount being greater due to underreporting of gambling losses). That actually works out to average annual spending of only $146 per person in middle-income households. And 35% of the spending was on gambling loses ($126 per household and $51 per person).

Examination of the spending data also shows that a greater share of all spending for out-of-home entertainment and sporting events has shifted to the higher middle-income households, a phenomenon called social stratification. Within middle-income households, the top half of households by income accounted for 2/3s (67%) of all middle income entertainment spending compared with only 1/3 for lower half.
When we look at all income households, not just middle-income ones, we find that the top 20% of income households’ shares of each category entertainment increased – community-based entertainment (+11%), out-of-town entertainment (+18%) and out-of-town sporting events (+19%). In the out-of-home entertainment and sporting events categories, the 20% of households with the highest income as a group spend more than double what the 40% of middle-income households did. The amount that high income households’ spend on out-of-town entertainment and sporting events, both at home and out of town, is half or more greater than that of middle income households.

Enough of the numbers! What does all this tell us about out-of-home entertainment spending by middle-income households? The conclusions seem quite clear. Middle-income households spend about a 1/3 (35% or possibly more) of their entertainment spending on gambling and that spending has significantly increased since 2000. They are also shifting their spending to video game hardware and software. Spending on trips for both entertainment and attendance at sporting events has taken a major hit. Middle-income households’ basically stable community-based entertainment and local sporting event attendance spending (only down 4% and 5% respectively since 2000) confirms the staycation trend; middle-income households are taking fewer trips and spending less when they do, while basically maintaining their entertainment spending in their local communities. This staycation trend probably also explains the increase in gambling spending due to the proliferation in the number of lotteries and casinos throughout the nation. Thirty-three different states now have a total of 869 casinos and number continues to grow; 43 states now have lotteries. Most middle-income adults don’t need to travel vary far to gamble.
Vol. XII, No. 2, February - March 2012
- Foundations Entertainment University & Amusement Expo
- Trends in middle-class entertainment spending
- DNA conference
- Toddlers don't need tokens to win crane machine prizes
- Family entertainment center architectural design: Getting it right the first time
- Construction progress at Club Liko in Cairo, Egypt
- Is what's happening to cinemas a bellwether for location-based entertainment?
- New clients


