Vol. XI, No. 4, July-August 2011
Bowling - changes to participation and its customers
Our company spends a lot of time and money conducting research to uncover trends that can give our clients a competitive advantage, both in the mix and design of their centers as well as their management and marketing. We've been working in the bowling industry for over 22 years and have spent a lot of time and money researching changes there. Here are some findings from our latest research in that segment of the out-of-home entertainment industry.
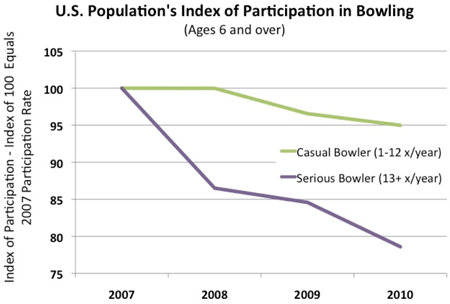
We examined data from one set of research surveys, comparing who bowled and their frequency of visits in 2007 right before the start of the recession with data for 2010. There was a decline in the total number of people who bowled in 2010 compared to in 2007, with the largest decline, 27%, occurring for hard core bowlers, those who bowled more than 30 times in the year. These would be league bowlers. However, casual bowlers who only bowled 1-4 times in the year only saw an 8% decline and represented 60% of all bowlers in 2010.
Findings from another set of yearly surveys showed a similar trend. That data defined casual bowlers as bowling 1-12 times a year, regular bowlers as 13-24 times a year and frequent bowlers as 25+ times a year. The 13+ group, what we will call serious bowlers, would predominately be league bowlers. Those survey findings showed that casual bowlers grew from 74% of all bowlers in 2007 to 78% in 2010, only experiencing a 3% decline in absolute numbers. Core bowlers declined from 26% of all bowlers in 2007 to only 22% in 2010, declining in absolute number by one-fifth (20%).

These findings are consistent with the long-term trend that bowling is experiencing, with league bowlers representing a declining share of all bowlers. The decline in casual bowlers in 2010 compared to 2007 is most likely attributable to a number of factors including the decline in the number of bowling centers (less availability) and the recession.
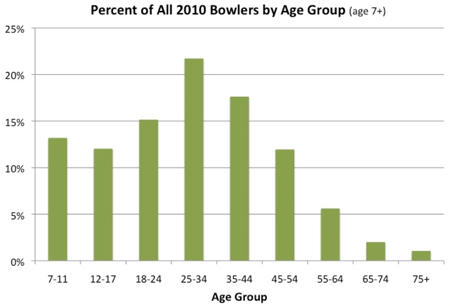
The largest percentages of bowlers are children 25% (age 7-17) and young adults— both parents who come with their children and adults coming without children— 55% (age 18-44),. These two groups represent 80% of all bowlers.

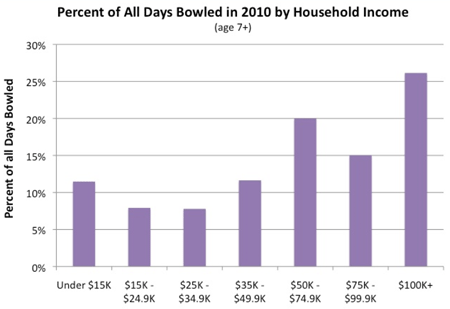
There is a direct correlation between income and days bowled in 2010. Households with $50,000+ incomes generated 61% of all bowling visits.

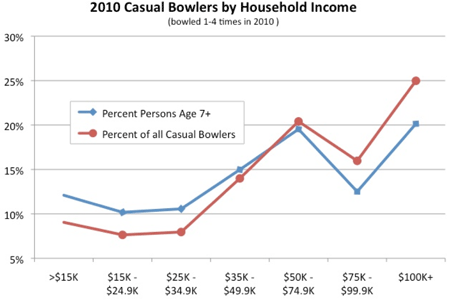
This correlation with income is also true with casual bowlers (1-4 times per year). 61% had $50,000+ incomes in 2010 compared with only 52% of the population.

We expect the trend of a decline in the number of casual bowlers to eventually turn to an increase as the number of upscale open-play bowling lounges and hybrid-bowling centers continues to increase. Currently in many markets in the U.S. the only bowling centers are old alleys with no appeal to the upper socioeconomic population, so those people just don't go bowling. Also, bowling became stigmatized during the past decades with the rundown and smoky condition of many bowling alleys and their dominance by leagues, making open-play bowling limited in availability. Because of this, much of the population hasn’t yet ventured out to discover the new, modern, smokeless, league-less and upscale bowling centers the industry is starting to offer including hybrid-bowling centers, lounges and boutique centers. Demand for quality bowling is elastic, meaning as quality facilities become available in any area, open-play visits will increase. Many of the guests currently visiting the more upscale bowling centers hadn't been in a bowling center for years, probably not since their teenage years.
We are currently working with clients on the renovation of two older bowling centers to become upscale open-play centers and the development of three new upscale bowling centers.
For more on trends in the location-based entertainment industry, see our article in this issue, The creative destruction of location.


