Vol. VII, No. 3, May-June 2007
- Editor's Corner
- Is history repeating itself? Location-based children's centers
- Last Foundations Entertainment University for 2007
- Away-from-home food and entertainment spending
- National Restaurant Association Show
- Discover great field trips
- The culture of pop versus soda
- Finish what's on your plate or ...
- Missed the slide show?
- Identifying the healthful eaters
- Get ready for the trans fat revolution
- New and current projects
Away-from-home food and entertainment spending
U.S. families with children spend a substantial chunk of change away from home on food and entertainment. But how much they spend varies drastically by household income, and this information is vital to you in targeting the right market to keep your LBE in the black.
We constantly review mega-trends and how they affect the revenue of eatertainment and location-based entertainment venues. Here are recent findings from our research:

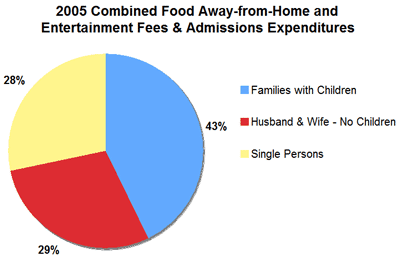
Spending in the U.S. by families with children is very significant. Their 2005 combined spending for food away-from-home and entertainment fees and admissions represents 43% of that category's total spending by all households.
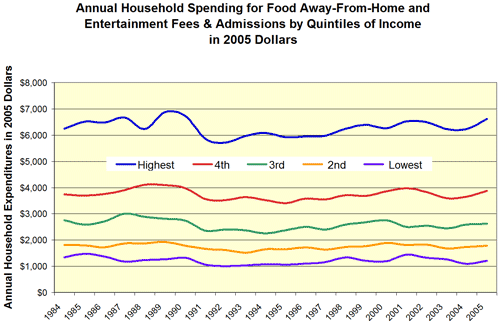
We looked at U.S. per household spending in that category from 1984 to 2005 by income quintiles and inflation-adjusted the spending for all years to be in 2005 dollars.

The graph makes several things evident. First, there is a difference in household spending by quintiles of income. The 20% of households with the highest incomes spend significantly more than the other four quintiles – 70% more than the fourth highest quintile and more than five times as much as the 20% of households with the lowest incomes. Second, over the 22 years, only the top and fourth-highest income quintiles have increased spending, while the spending of the three lowest income quintiles has declined. The top quintile has increased its spending by 6% and the fourth-highest quintile by 4%. Remember, this is in inflation-adjusted dollars to give you a realistic picture.
The data and graph make clear that the top 40% of households by income are representing the largest slice of the overall spending pie for food away-from-home and entertainment fees and admissions (65% of all spending in 2005).
For more information on entertainment and restaurant spending, see last issue's article, Restaurant and entertainment expenditures.
Vol. VII, No. 3, May-June 2007
- Editor's Corner
- Is history repeating itself? Location-based children's centers
- Last Foundations Entertainment University for 2007
- Away-from-home food and entertainment spending
- National Restaurant Association Show
- Discover great field trips
- The culture of pop versus soda
- Finish what's on your plate or ...
- Missed the slide show?
- Identifying the healthful eaters
- Get ready for the trans fat revolution
- New and current projects


