

Vol. XIII, No. 2, February 2013
- Editor's corner
- Evidence that the staycation trend is both real & long-term
- Foundations Entertainment University - a 3-fer in March
- The bifurcated entertainment market; High Fidelity or die!
- A counterintuitive way to increase profits - scarcity
- 2012 North American cinema attendance increases
- Biases that can cause us to make bad decisions
Evidence that the staycation trend is both real & long-term
We recently dug into unpublished data from the U.S. Consumer Expenditure Survey to determine how real the staycation trend is in respect to spending at location-based entertainment venues during trips and whether it is only recession-based or perhaps a much longer term trend. For our analysis, a trip is defined as further than 50 miles from home or on an overnight trip, which includes vacations.
The Consumer Expenditure Survey collects information on the spending habits of American consumers, including data on their expenditures, income, the number of households making particular expenditures and other household characteristics, using both a Quarterly Interview Survey and the Diary Survey of approximately 7,000 households each year. The survey is conducted by the U.S. Census Bureau division of the U.S. Bureau of Labor Statistics. Entertainment spending in this article is defined as fees and admissions at location-based venues including movies, theme parks, concerts, museums, zoos, FECs, plays and similar entertainment-type venues.
Our CEO, Randy White, first reported our findings during his keynote speech at the DNA (Digital Out-of-Home Interactive Network Association) conference held January 21, 2013 in London. This is the first time we are sharing the results online.
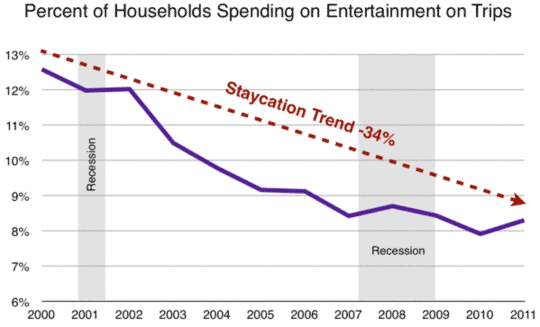
The first thing we looked at was participation – what percent of all households spent money each year on entertainment during a trip. Since 2000 the percentage of those spending households has decreased by 34%. As you can see from the graph, it is not a recession-caused trend, but rather a long-term trend.
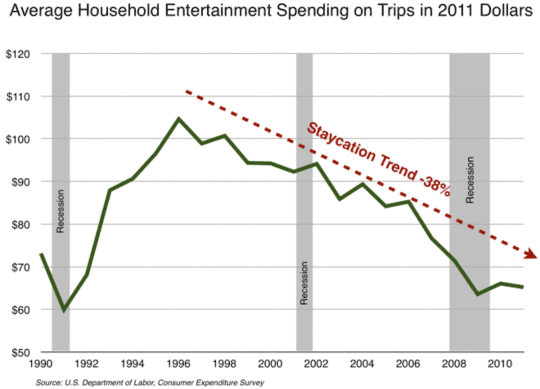
We then examined average household entertainment spending during trips and found the exact same long-term trend (All spending data has been income-adjusted to 2011 dollars.) This time we went back to 1990 to see when the staycation trend might have started.
To verify that the staycation trend indicated by the above spending data is indeed a staycation trend and not just the result of a decrease to all location-based entertainment (LBE) spending, we also examined household non-trip community-based entertainment (CBE) spending (We’ll have more coverage about community-based entertainment trends in our next Leisure eNewsletter.)
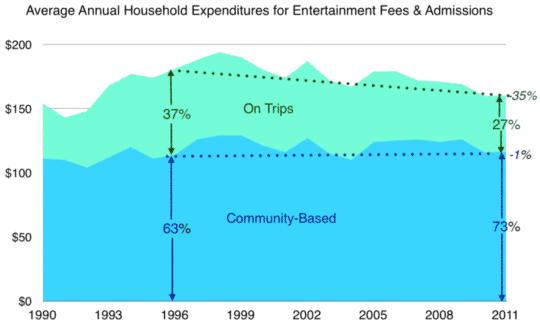
Since 1996, average household CBE spending has only varied slightly. In 2011, it was 1% higher than in 1996. On the other hand, trip entertainment spending decreased 35% since 1996. In 1996, entertainment spending on trips was 37% of all LBE spending. In 2011 it had decreased to 27%. Since 1996, average household total LBE spending has decreased by 12% with all the decrease resulting from the reduced entertainment spending on trips
The data clearly shows that there is a very long-term staycation trend that started 15 years ago.
Next we dug down deeper into the data to examine whether the decrease in household participation in entertainment spending on trips varied by household income. We examined quintiles of income, as that is the best methodology for a longitudinal analysis to factor out inflation and income changes.
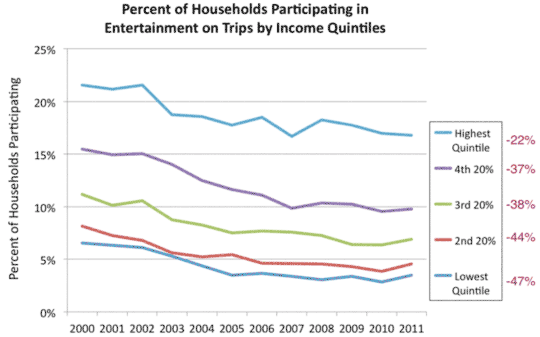
The graph shows that the magnitude of the staycation trend is negatively correlated to household income. The higher the income, the less the decrease is to participation in entertainment spending. Households in the top quintile (20%) of income saw approximately a one-quarter (-22%) decrease in participation in trip entertainment spending between 2000 and 2011. The lowest quintile households saw almost a one-half decrease (-47%) in participation during the same eleven years.
The following graph shows how spending changed for households by quintiles of income.
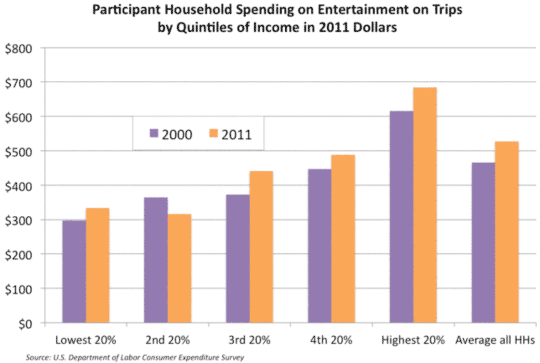
Although the percentage of households that spent for entertainment on trips declined over the eleven years, for all but the 2nd quintile group, those households that did spend on entertainment during their trips increased their average spending. These entertainment-spending households increased their average spending by 13%.
Finally, we dug into even more detailed household income data to look at both participation in spending and the amount of spending for entertainment on trips in 2011.
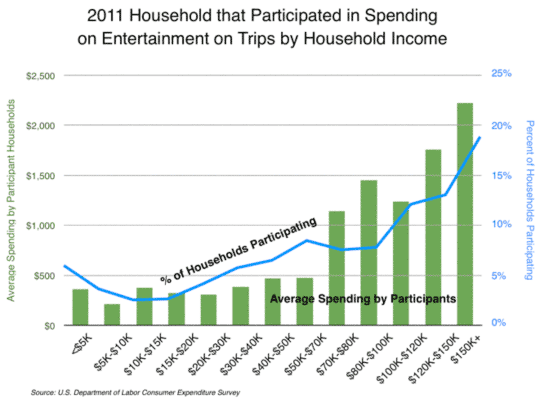
The graph shows that there is a definite positive correlation between household income and both the percentage of households that spent for entertainment on trips and how much they spent. In 2011, households with $100,000 and higher incomes were 18% of all households, yet they accounted for almost half (48%) of all trip entertainment spending.
A recent analysis by the U.S. Bureau of Labor Statistics found that the percentage of households reporting any travel expenditure declined by one-tenth (10%) between 2005 and 2011. This indicates that the percentage of households who took a trip declined by one-tenth during that period. This definitely correlates with the decline in entertainment participation we found. Our analysis shows a 9% decline in the percentage of households spending on trip entertainment during the same six years. Clearly, the staycation trend is predominately due to a declining percentage of households who are taking trips and secondarily to those households who spent less on trips.
Our conclusions from all this analysis are twofold:
- There's a strong 15-year long-term downward trend of the percentage of households who spent at entertainment venues during a trip.
- There is a definite social stratification trend occurring where an increasing share of the remaining entertainment spending is shifting to higher income households.
There is little doubt the staycation trend is very real.
Vol. XIII, No. 2, February 2013
- Editor's corner
- Evidence that the staycation trend is both real & long-term
- Foundations Entertainment University - a 3-fer in March
- The bifurcated entertainment market; High Fidelity or die!
- A counterintuitive way to increase profits - scarcity
- 2012 North American cinema attendance increases
- Biases that can cause us to make bad decisions