Vol. XII, No. 4, June 2012
- Editor's Corner - International travels
- What a difference 21 years makes with household spending
- New free directory for agritourism businesses
- Sustainability A to Z: Still relevant for both consumers and industry
- Foundations Entertainment University - July 17-19 in Chicago
- The potential of the stay-at-home mother with young child market
- Attracting Generation X
- Theme park attendance is counterintuitive to macro LBE spending trends
Theme park attendance is counterintuitive to macro LBE spending trends
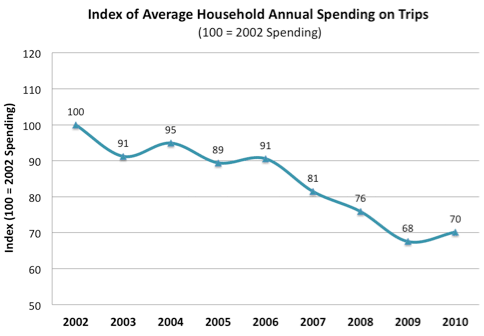
In one of Randy White’s blogs, he wrote about the 2000 to 2010 30% decline in average household spending for entertainment while on trips, what has been referred to as part of a staycation trend. A chart in his previous blog shows how the decline has been a long-term trend, not just attributable to the economic turndown that started in 2008.
So based on that data, you would suspect that there has been a decline in major theme park attendance – less visits results in less spending. Well it ends up that just the opposite occurred. Major theme park attendance has been increasing.
You might wonder how this is possible. It’s due to the fact that macro data, such as average household entertainment spending on trips, applies to all spending at all possible venues, whereas there can be a micro trend that is just the opposite when you look at specific venues.
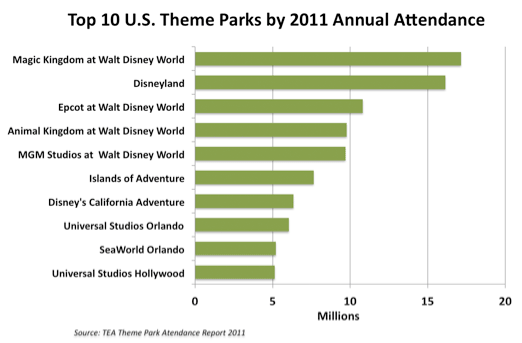
So here’s what we found. We examined attendance at the top 10 attended theme parks in the U.S. between 2002 and 2011. Over that decade, the same theme parks have consistently been in the top ten. Their 2011 highest to lowest order is:

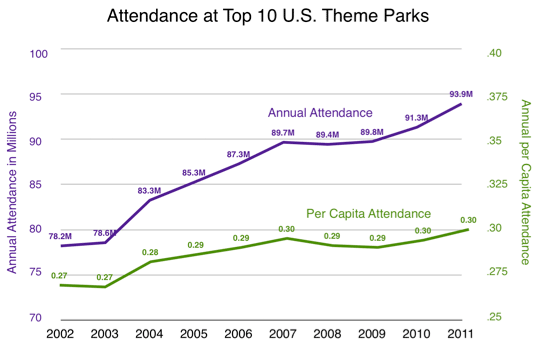
The graph below shows both the total attendance at the top 10, but more importantly per capita attendance. Just examining total attendance doesn’t give a true picture of visits, as over the decade, the population of the U.S. grew by 9%, so you would expect that to drive attendance growth. By also examining per capita attendance, we get a more precise idea of their market capture, are people going less or more often.
As you can see, total attendance grew by 20% over the decade, but even more impressive is that per capita attendance grew by 11%. The annual per capita attendance grew from 0.27 in 2002 to 0.30 in 2011. Put another way, in 2002 on average, Americans attended one of the top 10 theme parks once over 44 months. The frequency increased to once ever 40 months in 2011.

This is impressive since between 2002 and 2010 average household location-based entertainment spending on trips (inflation-adjusted) declined by 30%.

The Great Recession had a very minor impact on attendance at the top 10 theme parks. Compared to 2007 pre-recession attendance, by 2009 per capita attendance was only down 1.7% and thereafter increased. During the same period, all entertainment spending on trips declined by 17%. It appears the top theme parks are getting a larger slice of a shrinking pie of entertainment spending on trips. Considering how expensive it is to attend one of these ten theme parks makes this performance even more amazing.

In light of the trend of declining trip entertainment spending, we believe this performance of the top 10 attendance theme parks can be explained by a number of trends occurring in the location-based entertainment industry:
- The flight to quality and to good value for disposable money and time, which does not equate to the lowest price. When people spend their disposable income and time, they want the best value for the investment. This means they will often chose the higher quality and more expensive option.
- Higher socioeconomic households accounting for a higher percentage of all entertainment spending on trips. The top 20% of income households accounted for 47% of that spending in 2002. It grew to 52% in 2010. These are the households who can best afford the expensive theme parks. Our research shows that there is a direct correlation between socioeconomics and theme park attendance. The higher the income and education, the greater the rate of attendance. The data indicates those higher socioeconomic households have continued to visit theme parks.
- Theme parks offer what is called a high fidelity experience. The more digital technology makes at-home and mobile device entertainment less expensive and more convenient, the more location-based businesses have to raise the fidelity of the experience they offer to counter the increasing attractiveness of convenience. Offerings that are at one extreme or the other – either high in fidelity or high in convenience – tend to be successful.
Rock stars sell out concerts at high-ticket prices because the experience is high in fidelity – it can’t be replicated in any other way, and because of that, people are willing to suffer inconvenience like crowds and parking for the experience. In contrast, a downloaded MP3 song is a low fidelity experience, but consumers give up high fidelity and buy music online because it’s super-convenient and low priced. The things that fall into the middle with moderate fidelity or convenience fail to win an enthusiastic audience; and fall into what is known as the fidelity belly.
Technology is pushing the boundaries of fidelity and convenience, continually raising the bar at each end. At-home and mobile device digital experiences are getting more convenient while at the other extreme, the top theme parks are getting higher in fidelity. As a result many entertainment venues are losing their appeal and becoming casualties of the fidelity belly, resulting in consumers shifting their spending to the two extremes and away from the lower fidelity and less convenient location-based entertainment offerings.
Many FECs now fall into the fidelity belly. Concepts that have raised their fidelity, such as some of the new hybrid bowling centers and bowling lounges, are doing exceptionally well, whereas older bowling centers are stuck in the fidelity belly and slowly dying.
The increasing per capita admissions that the top theme parks are capturing indicates that the public, and especially higher socioeconomic households, are willing to visit and spend at high quality entertainment venues that offer good value. Unfortunately, as we travel the country, we continue to see many FECs, including many newer ones, being developing with design paradigms of the past and dooming themselves to the fidelity belly.
The successful future for FECs and related types of LBEs, including bowling centers, is to target and attract the higher socioeconomic market. That’s where the attendance and spending is today and as the trends indicate, will grow even larger in the future.
Vol. XII, No. 4, June 2012
- Editor's Corner - International travels
- What a difference 21 years makes with household spending
- New free directory for agritourism businesses
- Sustainability A to Z: Still relevant for both consumers and industry
- Foundations Entertainment University - July 17-19 in Chicago
- The potential of the stay-at-home mother with young child market
- Attracting Generation X
- Theme park attendance is counterintuitive to macro LBE spending trends


