

Vol. XIX, No. 7, August 2019
- Editor's corner
- Attention spans are shortening; trends don't last as long
- The evolution of the FEC industry - over expansion and opportunity
- Big investment in immersive mixed-use entertainment by Kevin Williams
- The cannibals are eating the CLV industry
- Essentials of hayride safety
- Is the obsession with beer justified?
- Review of Bar K - a multispecies social eatertainment venue by Linda Beckring
- The importance of great restaurant ambiance
- Do you know your cost of goods sold percentage?
- Jim Kessler gives it to us straight
- Cathedral-tainment
- Home is the new hangout
- Out-of-home entertainment & arts spending by occupation
- Randy's travel tips
Out-of-home entertainment & arts spending by occupation
In June we issued our white paper A perfect storm is disrupting the legacy location-based entertainment business model. The white paper discussed the gentrification of out-of-home entertainment and arts (OOH E&A) spending due to both the loss of the middle class and a shift of both OOH time and spending to college graduate households. For example, between 2000 and 2017, bachelor's and higher degree households grew from 47% of all OOH E&A spending to almost three-quarters (72%).
Peter Starkel, an industry colleague whose firm Fun Advisors specializes in branding and marketing of OOH entertainment venues, wrote us this comment in response to the white paper:
“I see another track that your report misses... There is a group of small business owners with only a high school education. These are generally your skilled trades, specialized retailers, and construction trades folks. Additionally, there are certain industries where the laborers are making a middle-class income (oil, skilled manufacturing, etc.) They generally have the discretionary income and seek a more "Regular Guy" experience.”
So, we rose to Peter's challenge and dug into our spending data to see how OOH E&A household spending varies by occupation. Here's the results.
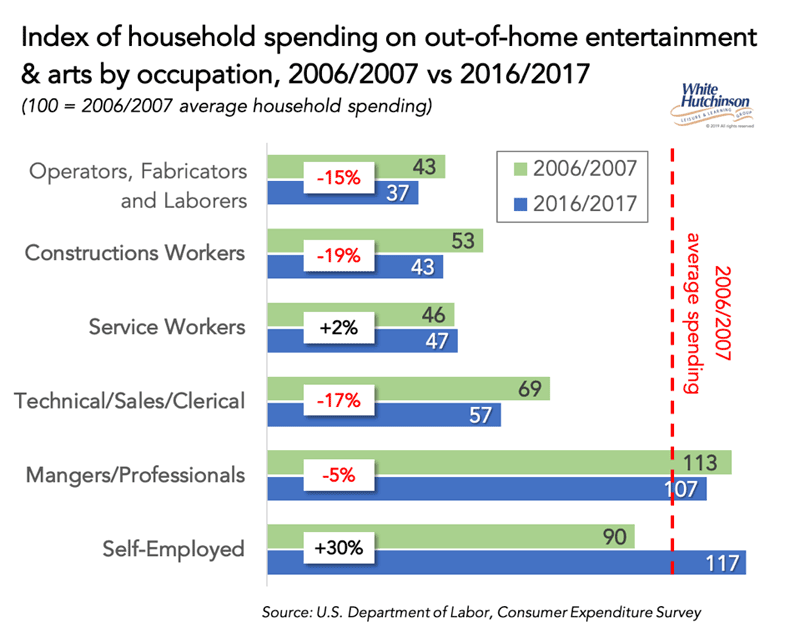
Managers, professionals and the self-employed, which includes many small business owners, are the highest spenders. Looks like Peter's thoughts that skilled trades workers are high OOH E&A spenders doesn't pan out, as their spending is at half the rate for that of managers, professionals and the self-employed.
However, sometimes the devil is in the details, so we dug further to see how the spending distributed for different categories of OOH E&A.
The above data included OOH E&A spending both in the local community** and on trips. Here's what the data shows for only community-based spending, which represents spending for community leisure venues (CLVs), including family entertainment centers (FECs).
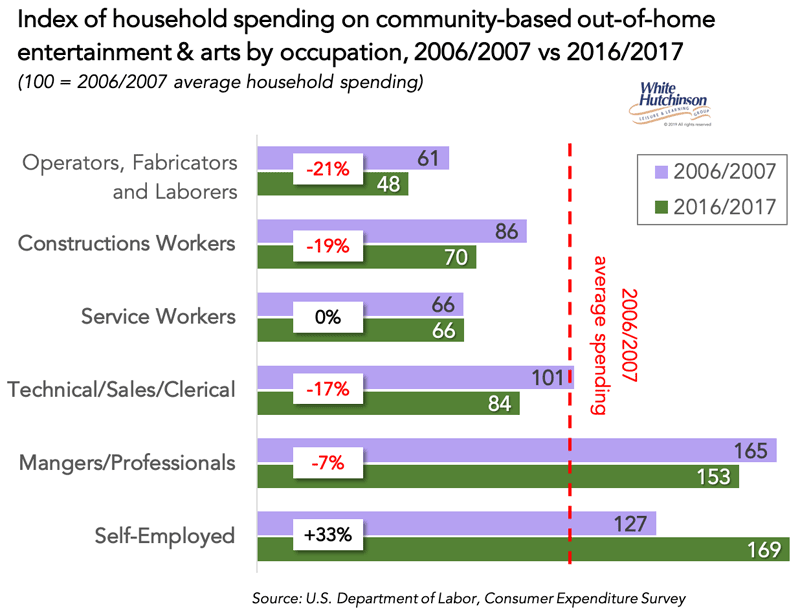
Both the changes in spending since 2006 and the rates of spending are very similar to that for all OOH A&E spending.
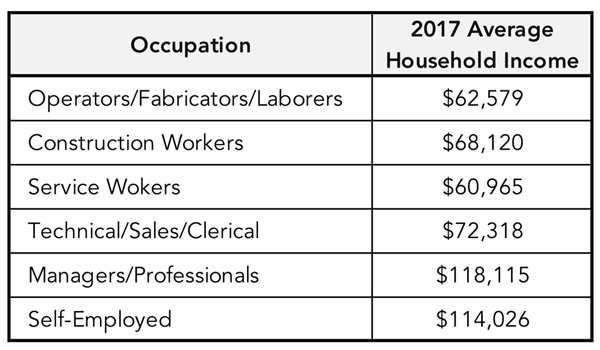
These results are not at all surprising when we look at the average household incomes for the occupations. In all our other research, we have found that this is a high correlation between out-of-home entertainment spending and income. Mangers, professionals and the self-employed who have the highest spending for out-of-home entertainment and arts also have the highest average household incomes.
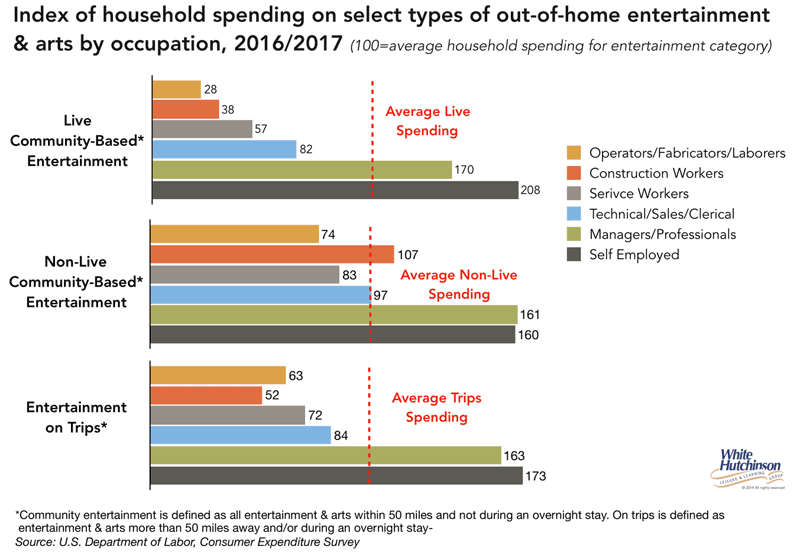
So, we dug even deeper into the data to breakdown community-based spending between:
- Live events such as concerts, plays, etc.
- Non-live events that would include most attraction-based venues such as most CLVs including FECs, movie theaters, local theme parks, zoos, etc.
That's when a bit of a different picture emerged. CLV spending by service workers, construction workers and operators, fabricators and laborers skews more to non-live than live. This is especially true for construction workers, who spend three times as much as those other occupations, slightly more than average for all households, at non-live versus live events.
When we look at the spending patterns for OOH E&A on trips (50+ miles from home and/or on overnight trip), the distribution is very similar to all OOH E&A spending, again with the self-employed and managers/professions the biggest spenders.
The above, of course, gives the impression that construction workers should be a target market for community-based, non-live entertainment, such as for family entertainment centers. But again, when we dig into the data and analyze it further, a different picture emerges. We calculated the share of all spending that each occupation contributes to each of the three OOH categories .
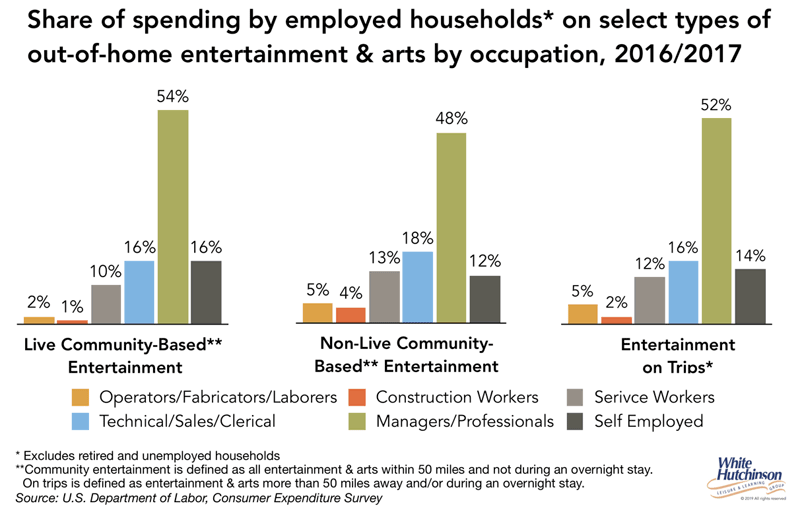
Although construction workers spend more than average for non-live community-based A&E, their spending is only 4% of all such spending. And although the self-employed have high household spending rates, they only account for 12% to 16% of all spending in the three OOH A&E categories of spending. Managers/professions account of half of all the spending (48%-52%). Although they are less than one-quarter of all households (22%), they are the market to target for all types of OOH A&E. When you target managers/professionals, you will still get some business from the other occupations as a secondary market, especially on an aspirational motivation basis.
* The occupation status of households is determined by the person or one of the persons who owns or rents the home.
** Spending in the local community is spending at venues within 50 miles of home and not on an overnight trip.
Vol. XIX, No. 7, August 2019
- Editor's corner
- Attention spans are shortening; trends don't last as long
- The evolution of the FEC industry - over expansion and opportunity
- Big investment in immersive mixed-use entertainment by Kevin Williams
- The cannibals are eating the CLV industry
- Essentials of hayride safety
- Is the obsession with beer justified?
- Review of Bar K - a multispecies social eatertainment venue by Linda Beckring
- The importance of great restaurant ambiance
- Do you know your cost of goods sold percentage?
- Jim Kessler gives it to us straight
- Cathedral-tainment
- Home is the new hangout
- Out-of-home entertainment & arts spending by occupation
- Randy's travel tips