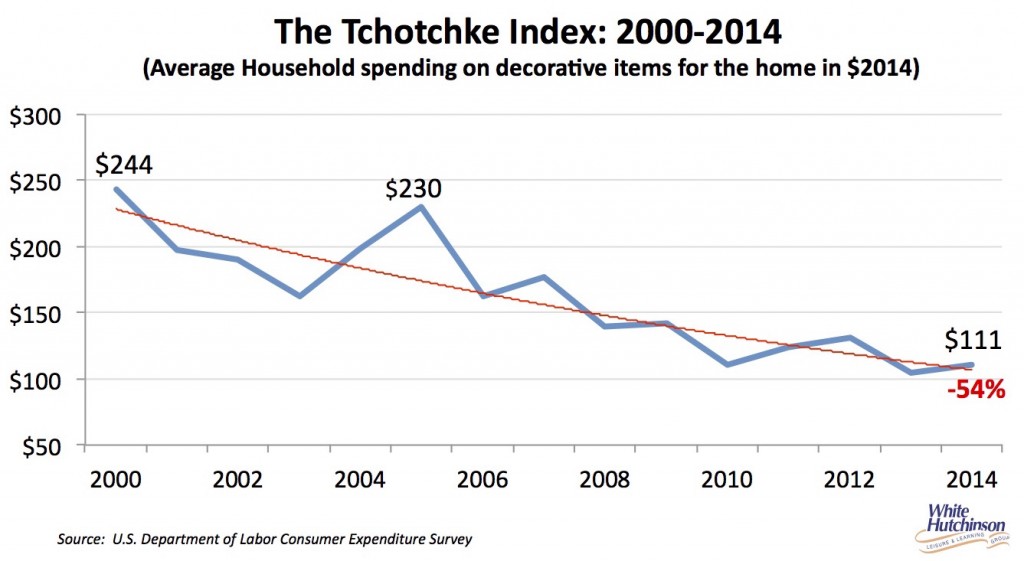
American’s spending on tchotchkes—trinkets, junk, yard sale finds, gift shop items, home decor and other decorative items for the home—is an excellent measure of their impulse spending on stuff. It’s thought to be a good gauge of American’s economic wellbeing, rising when Americans are feeling economically flush and falling when they are feeling financially pinched. Back in 2007 the American Consumers Newsletter started to track that spending and dubbed it the Tchotchke Index.
We dug into U.S. consumer spending data to show you what has been happening to the index since it’s 2000 peak of average household tchotchke spending of $244 (in 2014 dollars). It fell to a low of $163 in 2003 following the 2001 recession, 9/11 and the dotcom bubble, recovered to $230 in 2005 and has been on the decline ever since to the low in 2013 of $104. In 2014 it when up slightly to $111, but is still down more than half (54%) from its peak in 2000.
It is no coincidence that we have seen a similar long-term decline in out-of-home entertainment spending starting in the early 2000s, rising in the mid-2000s and then declining ever since – a pattern comparable to the Tchotchke Index. Many Americans through 2014 cut back their spending on not only tchotchkes, but also on other discretionary items including location-based entertainment.
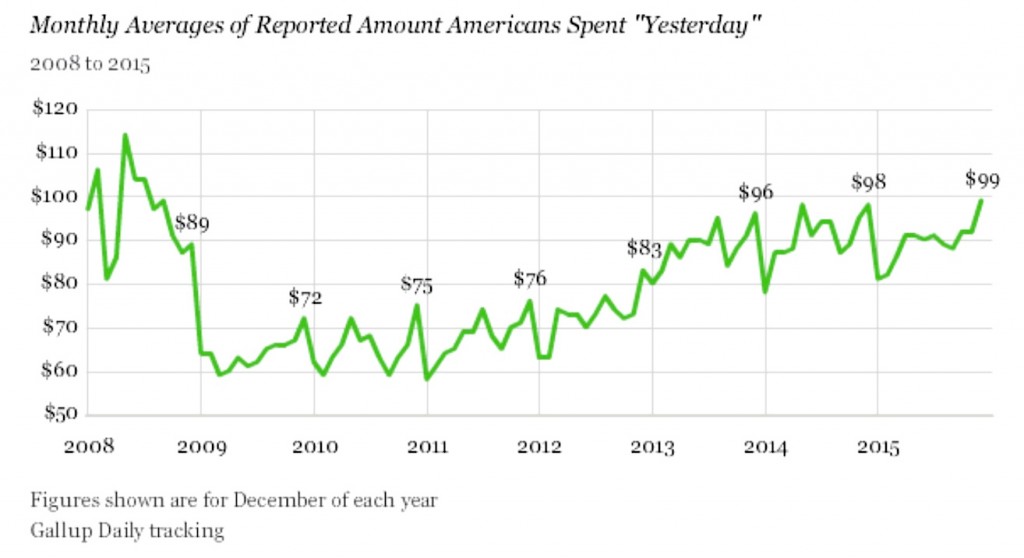
The Tchotchke Index’s long-term decline is counter to an upward trend in Americans’ everyday spending. Each day, Gallup asks Americans how much they spent “yesterday” in restaurants, gas stations, stores or online – not counting home, vehicle or other major purchases, or normal monthly bills – to provide an indication of Americans’ discretionary spending. Gallup reports Americans spent a daily average of $99 in December 2015, up from a December 2009 low of $72 in the depths of the Great Recession.
There are at least two possible explanations for these opposite trends – a decline in the Tchotchke Index and increasing consumer spending. One is that the spending reflected by Gallup deals more with essentials and not the totally discretionary items in the Tchotchke Index. For example, as consumers feel more economically confortable, they might buy some new clothes they had been putting off or they might buy an occasional steak at the grocery store rather than chicken, whereas they still might not feel flush enough with money to spurge on some home décor item. Another explanation is that they might be shifting their spending from stuff to experiences.
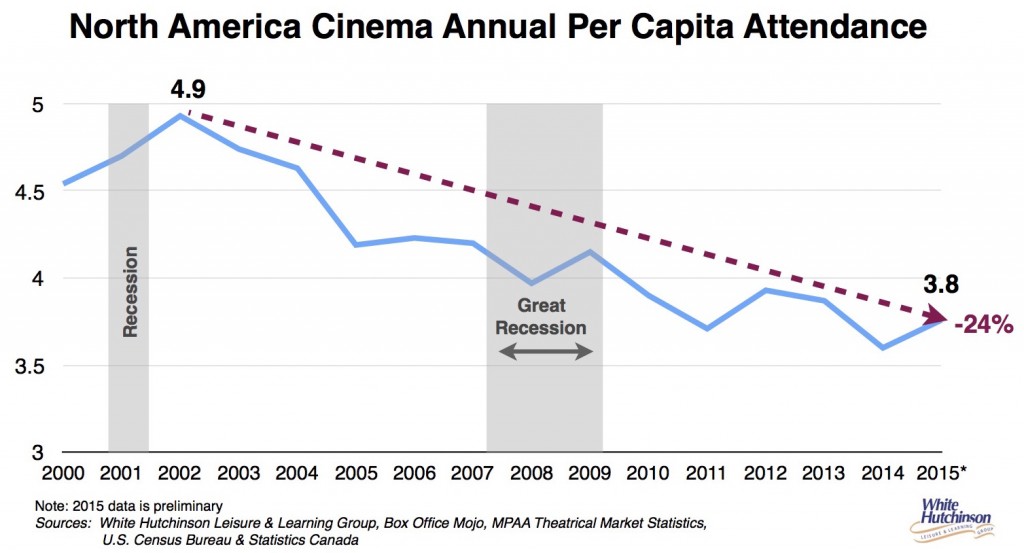
Data on community-based entertainment spending is only available through 2014, and it shows a downward spending trend, basically consistent with the Tchotchke Index. However, there is anecdotal evidence that out-of-home entertainment spending may have turned upward in 2015. We did see an uptick in movie theater per capita attendance in 2015 after its long-term decline that started in 2003 with capita moviegoing rising 4% compared to 2014, but it is still down 24% from its high in 2002 of 4.9 visits per person. There was also some growth in restaurant sales in 2015.
Our company conducts our own proprietary national surveys on participation at different types of location-based entertainment venues and for different attractions. We just completed our annual survey for 2015 with 2,500 adults. The results show a definite increase in the percentage of participating American adults compared to 2014 for every type of major FEC attraction. And, with few exceptions, the increase was across all age and income groups.
What this may mean is a little brighter future for community leisure venues. However, no different than many other industries, it is the “A” businesses that are winning and capturing the lion’s share of business. With location-based entertainment, the vast majority of the business comes from higher socioeconomic households. These households seek out the high quality venues to get the most bang for their leisure time, and are willing to pay a fair price for it. Unlike just a decade or so ago, there is no longer room in the market for mediocrity.


