If you operate or plan to develop a tourist-based entertainment venue or restaurant, it is important to understand trends that impact both overall market potential and the optimal target of customers.
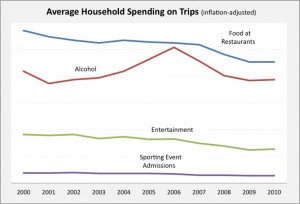
This graph shows changes to and the relative amount of average household spending during out-of-town trips for food, alcohol, entertainment and admission to sporting events.
When people are on trips, they spend over five times as much on food and drink as they do on both entertainment and attending sporting events combined. However, over the past decade there has been a decrease in average household spending in all categories. The declines have all been long-term trends not attributable to the Great Recession that started in December 2007 with the exception of spending on alcohol. The decline in alcohol spending, after a continued rise from 2001 to 2006, appears to have been caused by the recession. (We believe the earlier rise in alcohol spending is less attributable to people drinking more, but rather to them buying premium drinks.)
However, looking at averages never tells you the whole story. It’s like describing a roller coaster by its average height. The devil is in the details.
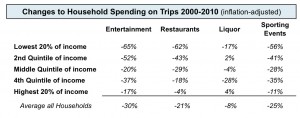
We dug deeper into spending data and found the following when we examined spending by households with different incomes:
 With the exception of liquor expenditures, there is a direct correlation between household income and the declines in spending. The households with the lowest incomes cut back their spending during trips the most.
When we looked at each category of spending by each quintile income group over time, we found that with a few exceptions the declines were long-term trends that started before the recession. The two exceptions were entertainment spending on trips by the highest 20% of households by income, whose decline started with the recession, and alcohol spending by all quintiles, which also started with the recession. Average household spending for food, alcohol, entertainment and admission to sporting events on trips by the lowest 80% of income households decreased by 27% over the decade whereas it only decreased by 4% for the 20% highest income households.
The net effect all these changes is that the households in the highest quintile of incomes (2010 incomes $92,000+), have increased their aggregate share of all spending by all households for food, alcohol, entertainment and sporting event admissions on trips from 42% in 2000 to 49% in 2010. Those 20% of high-income households now spend almost as much as the entire other 80% of households.
We believe the implication of all this is that out-of-town venues need to make sure they offer upscale experiences in facilities with good ambiance and quality food and beverage offerings to capture the higher socioeconomic market that now represents the greatest slice of spending (and based on long-term trends, will probably grow in share in the future) from a overall decreasing size pie of household expenditures on trips.


