

Vol. XIV, No. 3, April 2014
The demographics & market shares for alcohol consumption
Our last coverage of alcohol sales was our article in December 2013 about wine being more popular than beer. The U.S. Centers for Disease Control and Prevention recently released 2012 statistics on who drinks in America. The results are for adults age 25 and older who have had at least 12 drinks in the past year. As you can see, drinking has a direct correlation to levels of education, with the percentage of college graduates who drink being almost double the percentage who did not finish high school.
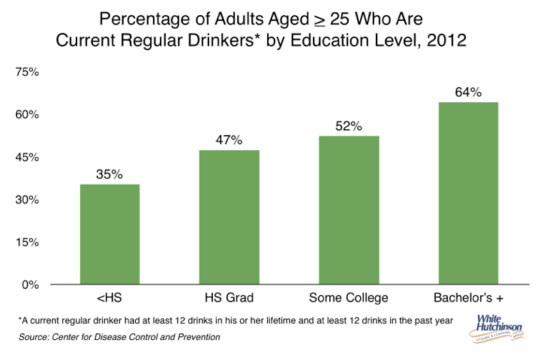
[The CDC survey found that 52% of adults age 18 and over where regular drinkers. Other studies have found a higher percentage of alcohol drinkers. A Rasmussen study in November 2013 found that 38% of American adults drink alcoholic beverages at least once a week and a total of 64% at least occasionally drink alcohol. A Gallup August 2013 poll found that 60% of adults drink alcohol at least occasionally]
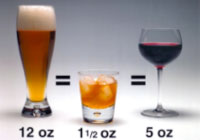
This got us curious on current market shares for wine, beer and spirits (liquor), so we dug into the sales data. Here’s how it breaks down on a per capita basis per serving (by standard serving size).
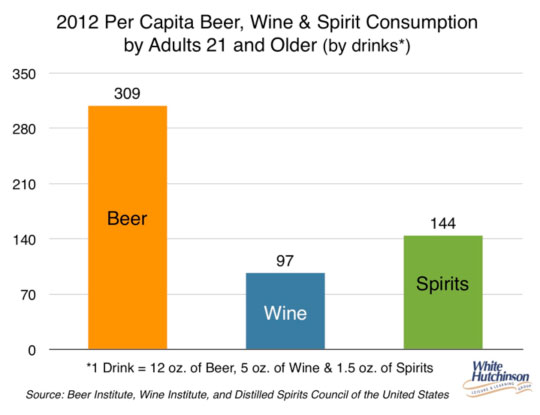
On a per capita basis by servings, beer is consumed over three times as much as wine and over twice as much as liquor.
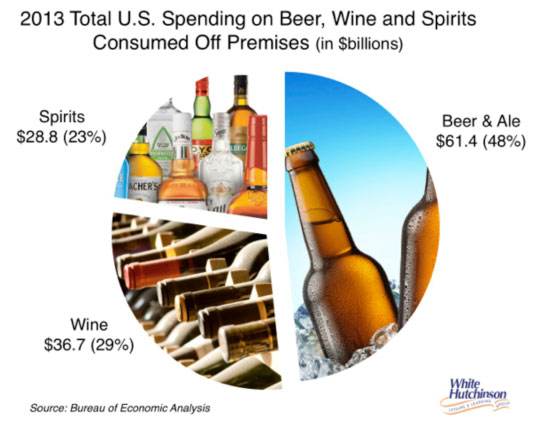
Here’s how it breaks down in terms of total sales for off-premises consumption (sales in liquor stores, C-stores, grocery stores, etc.)
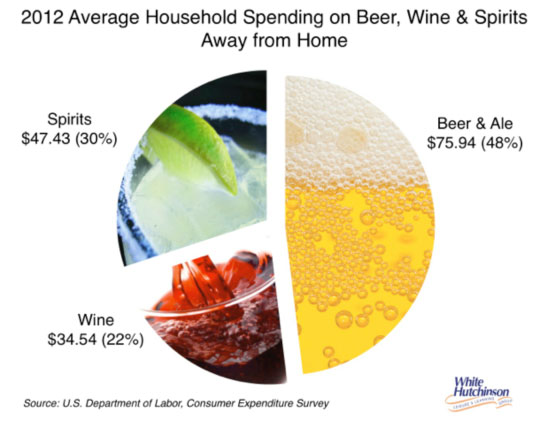
We then looked at alcohol sales consumed away from home, which takes place predominately at restaurant, bars and entertainment facilities that sell alcohol.
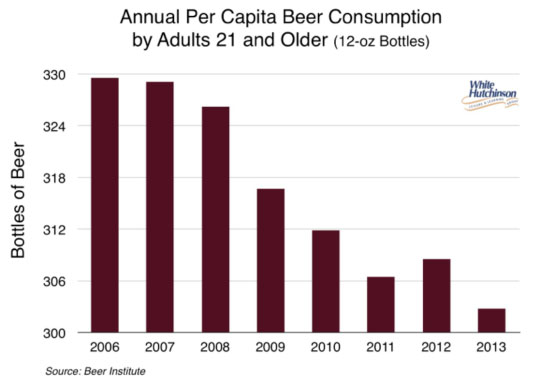
Beer sales have been on a long-term decline in per capita consumption as wine sales have been increasing. 2013 adult per capita consumption of beer was 303 bottles per person, but we know this is overstated as there is a lot of underage drinking (have any doubts, just check out college students).
With beer sales having the largest dollar volume, we dug deeper in the sales data to see how that market breaks down between domestic, imported and craft beer sales. To get a realistic picture based on consumption, since imported and craft beers usually cost more than domestic beer, we looked at sales by volume (barrels of beer). Here’s how that breaks down.
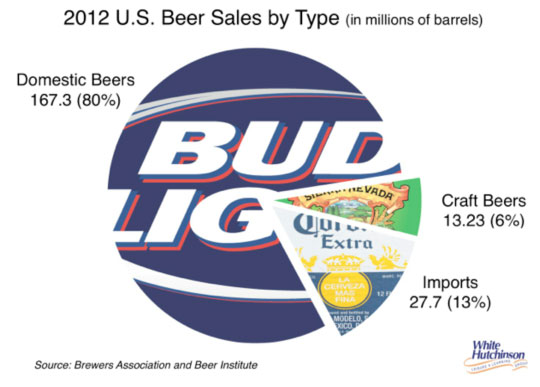
When it comes to domestic beer, Bud Light dominates, with 2.5 times the case sales of second place Coors Light.
Unlike domestics, imported beer sales are increasing. By volume, they were up 4.5% in 2013. There Corona Extra dominates at almost double (1.8 times) the sales of 2nd place Heineken. Modela Especial is only 4% behind Heineken in sales. Modela Especial’s volume increased 20% in 2013.
Craft beers are the fastest growing segment with 2013 volume up 6.5% and dollar sales up 20% to 7.8% of total U.S. beer sales and 6% of total sales by volume. The leader is Samuel Adams. 45% behind it in volume is Sierra Nevada.
At the end of 2013 there were 1,237 brewpubs, 1,412 microbreweries and 119 regional craft breweries. Microbrewers and regional craft breweries have increased in number by almost one-fourth (23%) since 2010.
Additional reading: