This is a print-friendly version of www.whitehutchinson.com/news/lenews/2012/november/article102.shtml


[ Index of Previous eNewsletters (www.whitehutchinson.com/ news/ lenews/ previous.shtml) ]
The U.S. Bureau of Labor Statistics’ Consumer Expenditure Survey (CEX) provides information on the spending habits of American consumers. The survey has been conducted annually since 1980 and provides reliable data to identify consumer expenditure trends. Our company has access to very detailed unpublished data from the CEX, so we are able to analyze areas of spending that the more aggregated published data doesn’t permit.
We decided to take a broad look at long-term trends of Americans’ entertainment spending. Our broad look at entertainment included five categories:
The CEX first started tracking cellular phone service in 1995, so we started the analysis with data for entertainment spending in that year.
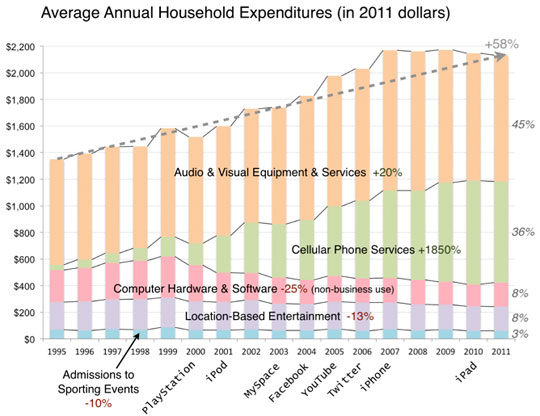
What is surprising is that when we inflation-adjusted the 16-years’ spending to 2011 dollars and combined all five categories of entertainment, total household entertainment spending increased by 58% (on average +$784) from 1995 to 2011. Americans obviously love their entertainment. However, what the data shows is that all the growth has come from the growth of in-home and mobile electronic entertainment and not spending at location-based entertainment and sporting event venues. In fact, electronic entertainment spending has grown at the expense of the out-of-home venues where household spending has decreased on average of 12% since 1995.

Electronic and digital entertainment equipment, services and software now make-up 89% of all entertainment spending and location-based bricks ‘n’ mortar venues only 11%. Back in 1995, venue-based entertainment represented 20% of all entertainment spending and the average household spent 14% more on it then than they did in 2011.
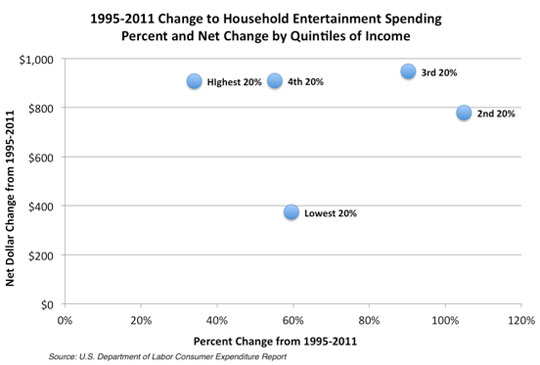
When we reviewed the spending data over the 16 years we discovered that lower-income households generally showed the greatest percentage declines in venue-based spending and the largest percentage increases for electronic entertainment spending. The lowest 20% of income households saw their average venue-based spending decline by one-third whereas the top 20% of income households only had a 7% decrease. Just the opposite was true for electronic entertainment spending. The bottom 20% income households saw their spending increase by 78% whereas the top 20% of income households saw it only increase by 47%. This indicates a more significant shift of entertainment spending by lower-income households to the digital and virtual worlds.

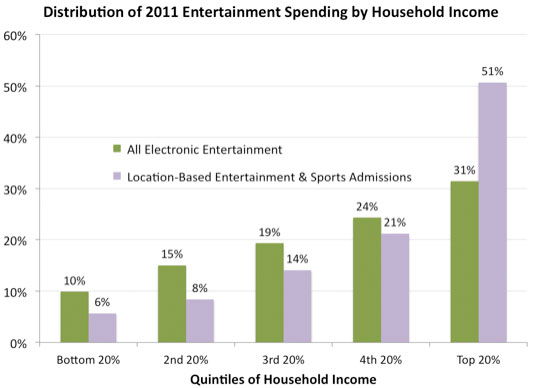
The top 20% of income households now spend more on location-based entertainment and admissions to sporting events than all the other 80% of income households combined. When it comes to electronic entertainment, the spending is more evenly distributed across all household income brackets, with the top 20% of income households only accounting for 31% of all spending. Nevertheless, there is still a positive correlation between incomes and spending.

What is surprising is that when we looked at changes to all entertainment spending between pre-recession 2006 and 2011, spending increased for all household income quintiles with the exception of the highest 20% where it based stayed constant (-1%).
So what does all this tell us? We believe the bottom line is that Americans are more than willing to spend on entertainment, even during challenging economic times. However, it appears that the increasing spending on electronic forms of entertainment indicates that many Americans consider that form of entertainment more convenient, affordable and a better value than out-of-home venue-based options. The challenge for location-based entertainment and sport venues is to increase the appeal of the experiences they offer to reverse this trend.
[ Index of Previous eNewsletters (www.whitehutchinson.com/ news/ lenews/ previous.shtml) ]
© 1999 - 2025, White Hutchinson Leisure & Learning Group, Inc.
The contents of this website and eNewsletters are protected by USA and international copyright law. Permission is granted to download and print single copites of any of the contents or articles for personal use. No other copies may be made. Educational institutions may obtain permission to make multiple copies for classroom use by e-mailing us with details. The contents of articles may be quoted provided credit is given to the "(author's name), White Hutchinson Leisure & Learning Group, Kansas City, MO, USA". All other rights for use or reproduction of the contents and articles are reserved.